Analysis
Bitcoin SV’s surge needs 25% more to breach ATH, again

Bitcoin SV, the coin rebuilt by the self-proclaimed Satoshi Nakamoto aka Craig Wright, seems to be at its A-game. Surpassing Bitcoin [BTC], Ethereum [ETH], XRP, Bitcoin Cash [BCH] and every other top 10 largest cryptocurrencies, in terms of RoI for the year so far.

Source: CryptoCurrencyChart
Bitcoin SV’s RoI is 283% [approximately [greater than 250%] as opposed to Bitcoin’s 41%. As seen in the chart, the rest of the cryptocurrencies dull in comparison.
Bitcoin SV and Golden Cross
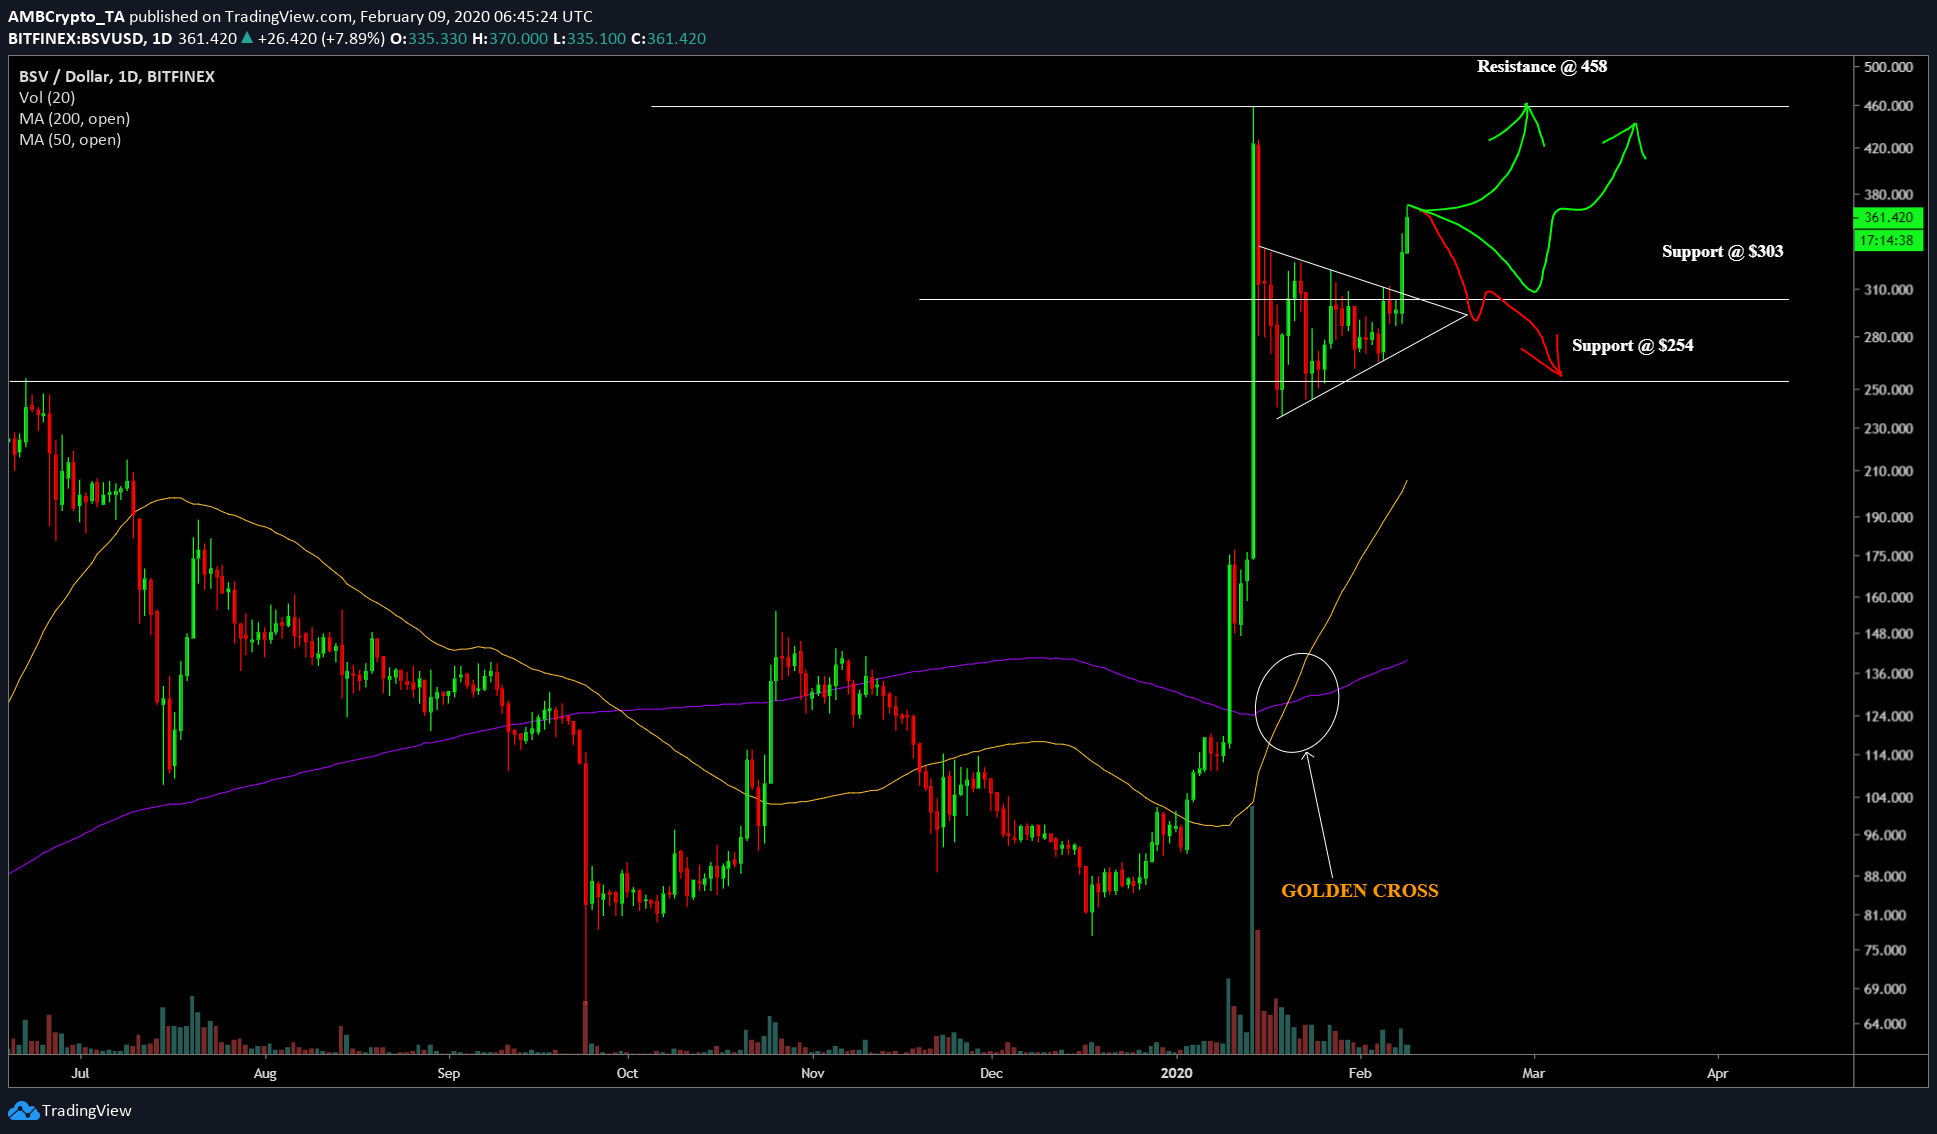
Bitcoin SV’s chart looks bullish as the price recently broke out of the symmetrical triangle leading to a 28% surge in under two days. Just before this surge, BSV broke its previous all-time high of $254 per coin, on January 14. At its recent peak, Bitcoin SV was worth $458 per coin, more expensive than what Bitcoin Cash is worth at press time, $453.

Source: BSV/USD TradingView
More importantly, BSV is undergoing one of the most bullish signals – a golden crossover. A golden cross is when a 50-DMA rises above the 200-DMA; typically, the 200-DMA is a trend that most assets follow. The price of an asset is, generally, said to be above the 200-DMA when there is a bull cycle, and a golden cross is said to be the start of this bull cycle.
This is a clear bullish indication for BSV. Moreover, the coin has already breached its previous ATH, meaning, the next run-up will be more advantageous for BSV holders. However, there are three important levels that the price might go through before the rally. The first is the resistance at $458, the new ATH and the remaining two levels are supports, one at $303 and the subsequent support at $254.
The first scenario is plain and simple, BSV will keep rising and hit the resistance at $458, if successfully breached, it’s clear skies. However, if the resistance is too strong and the bears overcome the buy-momentum, there will be a retest of the first support at $303 and a possible short squeeze. Following this, the price will re-surge and retest the $458 level again.
In an extremely bearish scenario, the price might trickle down from $303 and test the support at $254, the likes of which are also possible.
Momentum
The MACD indicator is showing that the buyers are strong and pushing for a bullish crossover, especially, after a recent decline down to the zero-line. RSI indicator perfectly represents the momentum, however, there is still enough gap between its current position and the overbought territory. This could indicate a manifestation of scenario 1, where the price retests the $458-level.
Conclusion
Bitcoin SV’s meteoric rise might have to do with its fast-approaching halving, which, historically, signifies a supply-shock, thus increasing the value of the coin. However, this is Bitcoin SV’s first halving since its fork from Bitcoin Cash on November 15, 2018. Hence it might be safe to assume that there is more upside left for BSV in the upcoming days. In any case, the test of $458 and $303-levels are very crucial in determining the destination of the price.
