Analysis
Bitcoin SV, Waves, Dogecoin Price Analysis: 07 December
Bitcoin’s dominance was as high as 63.6% at press time after registering a hike that saw it climb from 61.6% last week. A sustained rise in this metric could spell trouble for the market’s many altcoins.
Bitcoin SV’s bulls attempted to defend the $183-level after breaching it a few hours before press time. Further down the crypto-ladder, Waves was strongly bullish while Dogecoin was in a period of consolidation above its level of support.
Bitcoin SV [BSV]
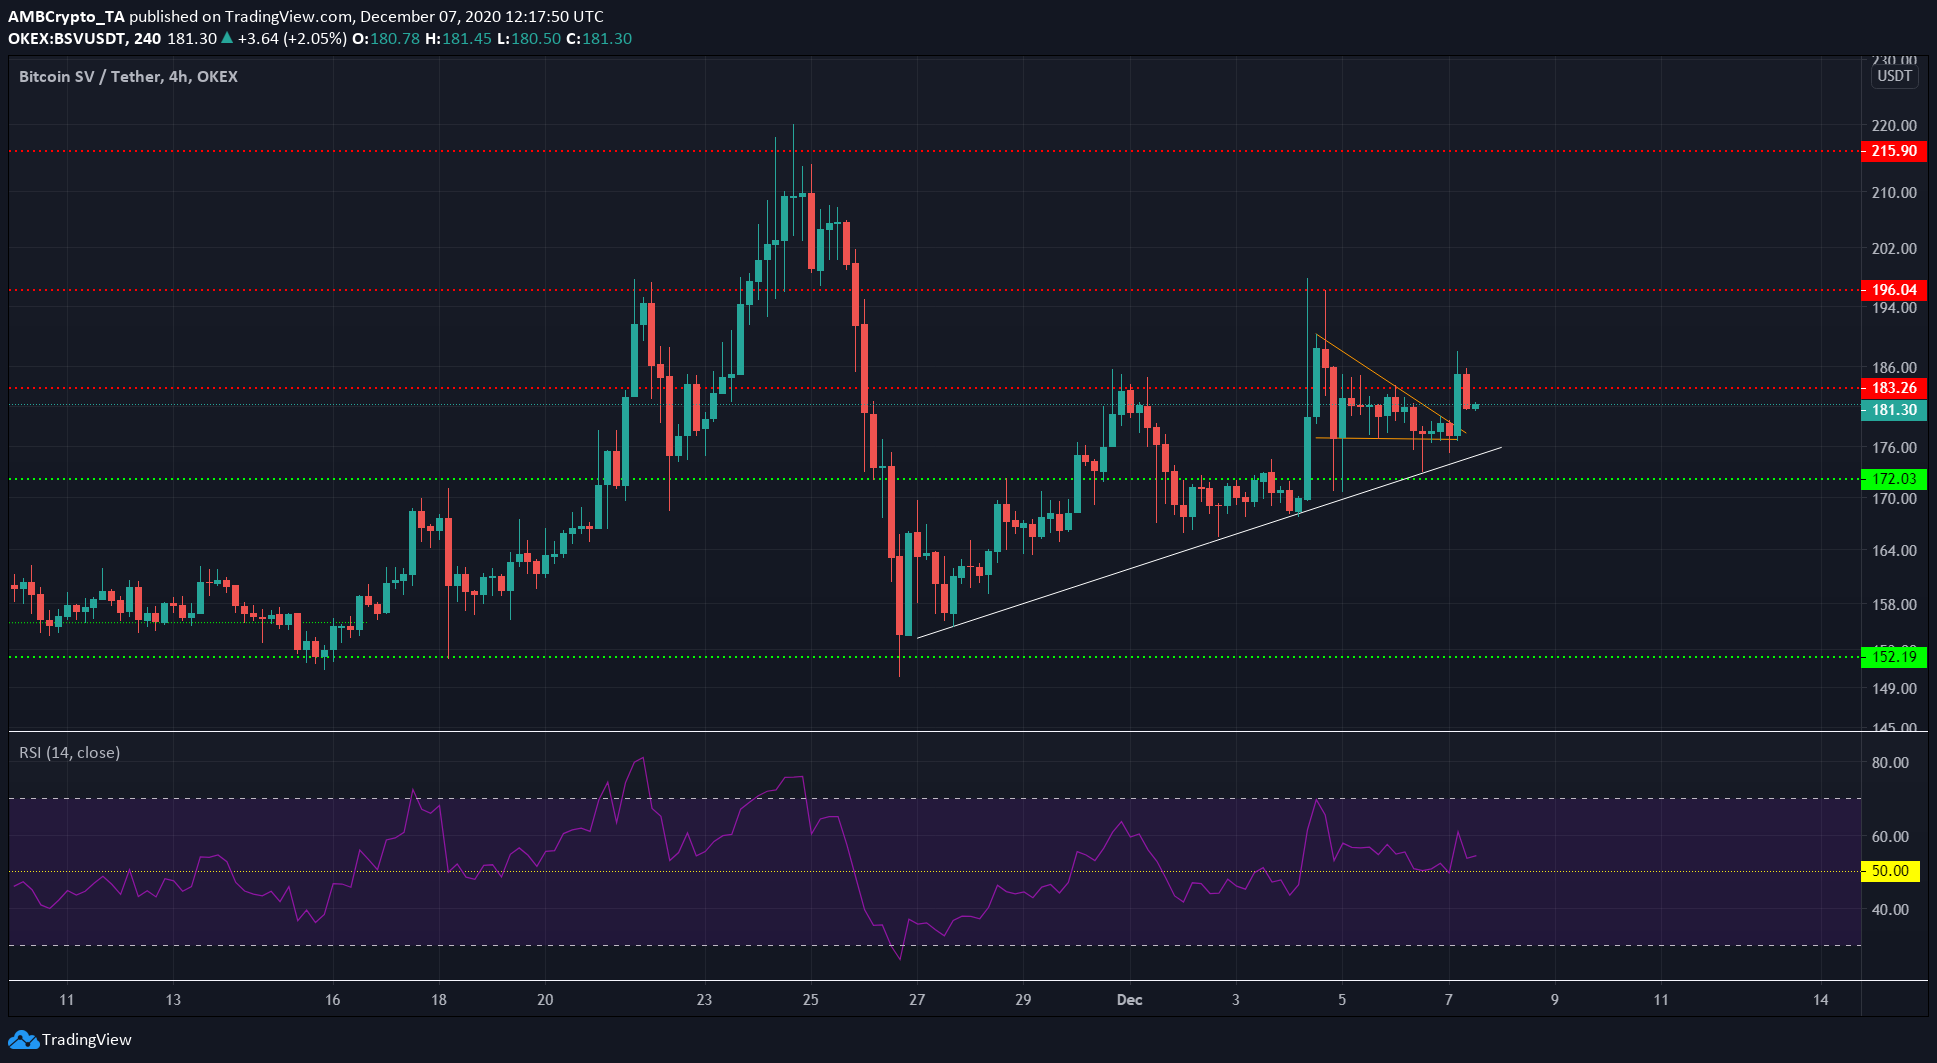
Source: BSV/USDT on TradingView
Bitcoin SV has been on an uptrend for the past couple of weeks. In fact, it has recovered more than 50% of the drop from the local highs at $210.
While it had closed above the $183-level of resistance in previous trading sessions, it looked unable to hold on to the level as the market bears could force the price to close back under the resistance level.
The RSI pointed to an uptrend in play after it tested the neutral 50-zone as support and headed north. The price formed a descending triangle (orange) and broke upwards backed by good trading volume.
A defense of the $183-level would be bullish in the near-term for BSV, while rejection could see BSV trade sideways at $177 or even drop to $172 in the coming hours.
Waves [WAVES]
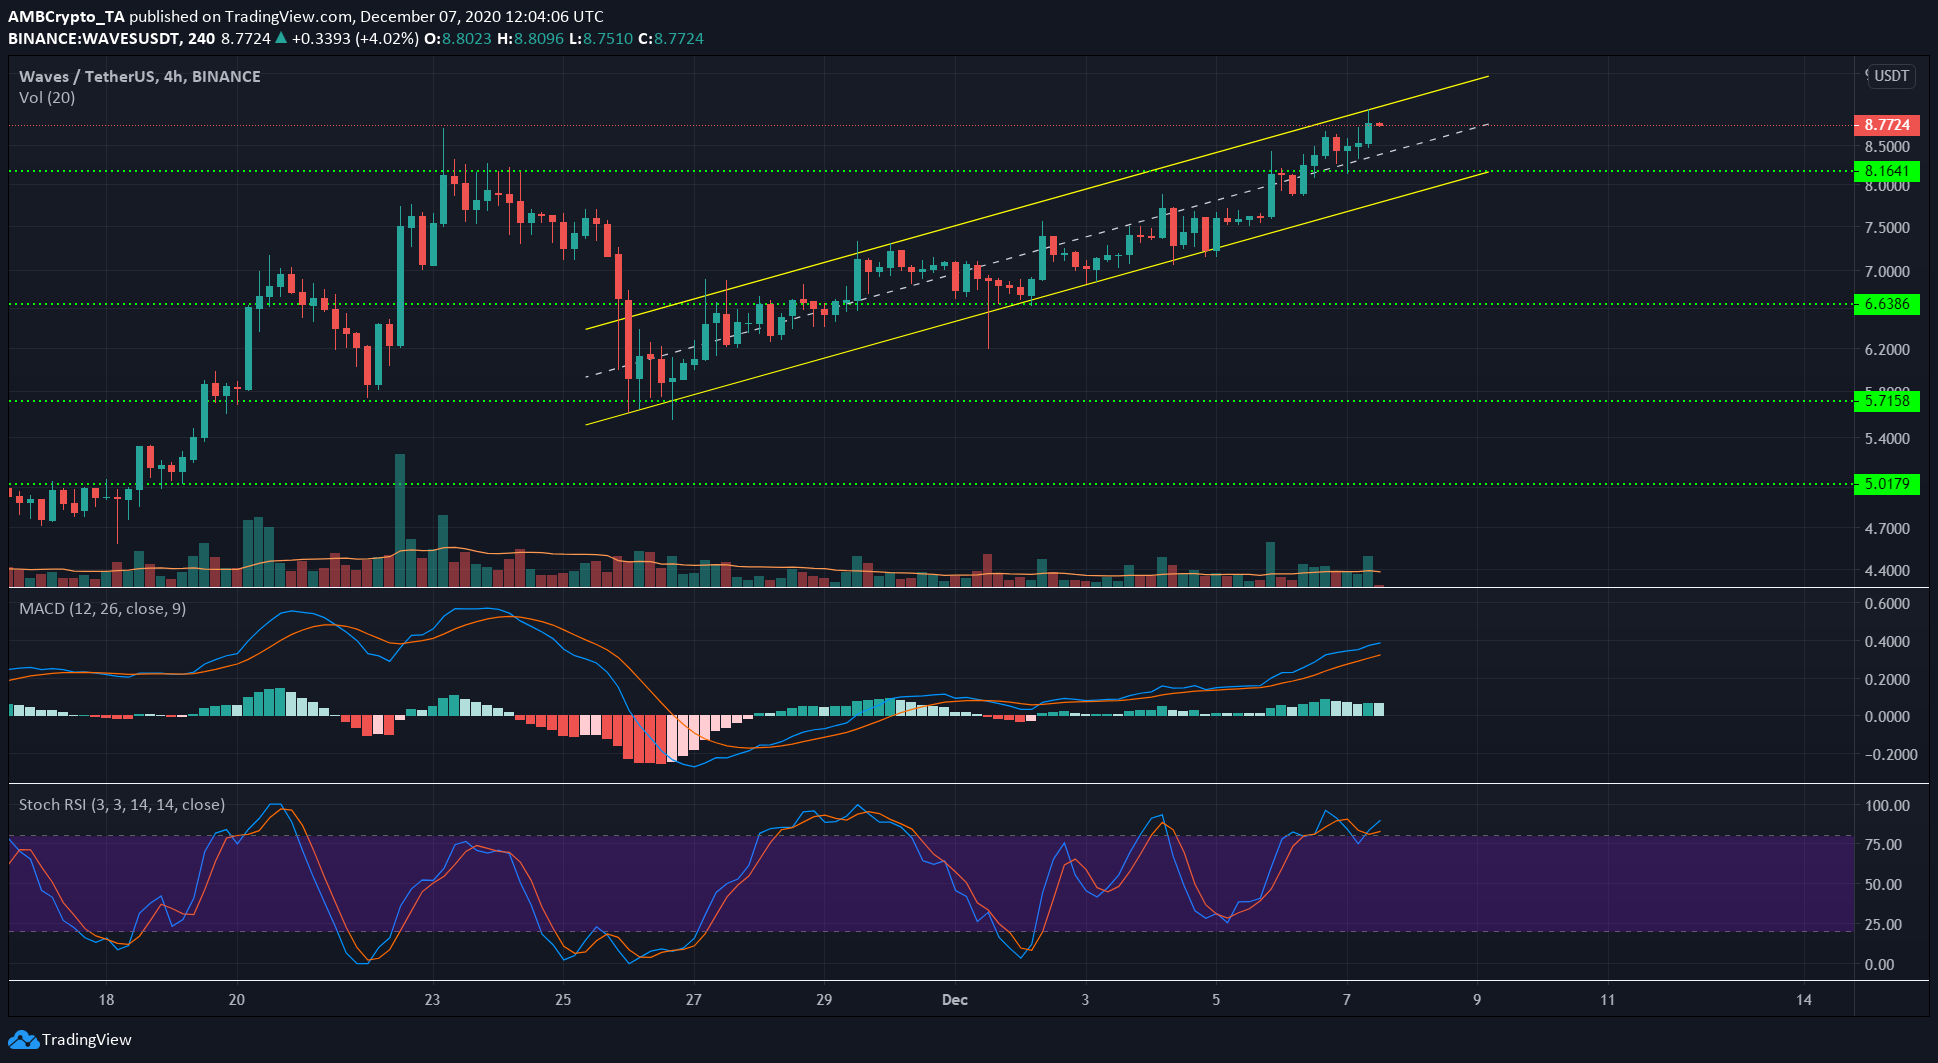
Source: WAVES/USDT on TradingView
Waves was trading in an ascending channel after appearing to form a head and shoulders pattern. However, the right shoulder was undone by the channel, and at the time of writing, WAVES had strong bullish momentum behind it, according to the MACD and the series of lower highs formed.
The Stochastic RSI indicated that a minor dip for WAVES could occur, with $8.43 being a pocket the price could revisit.
A close beneath the channel could take the price towards the $6.62-support level or even lower.
Dogecoin [DOGE]
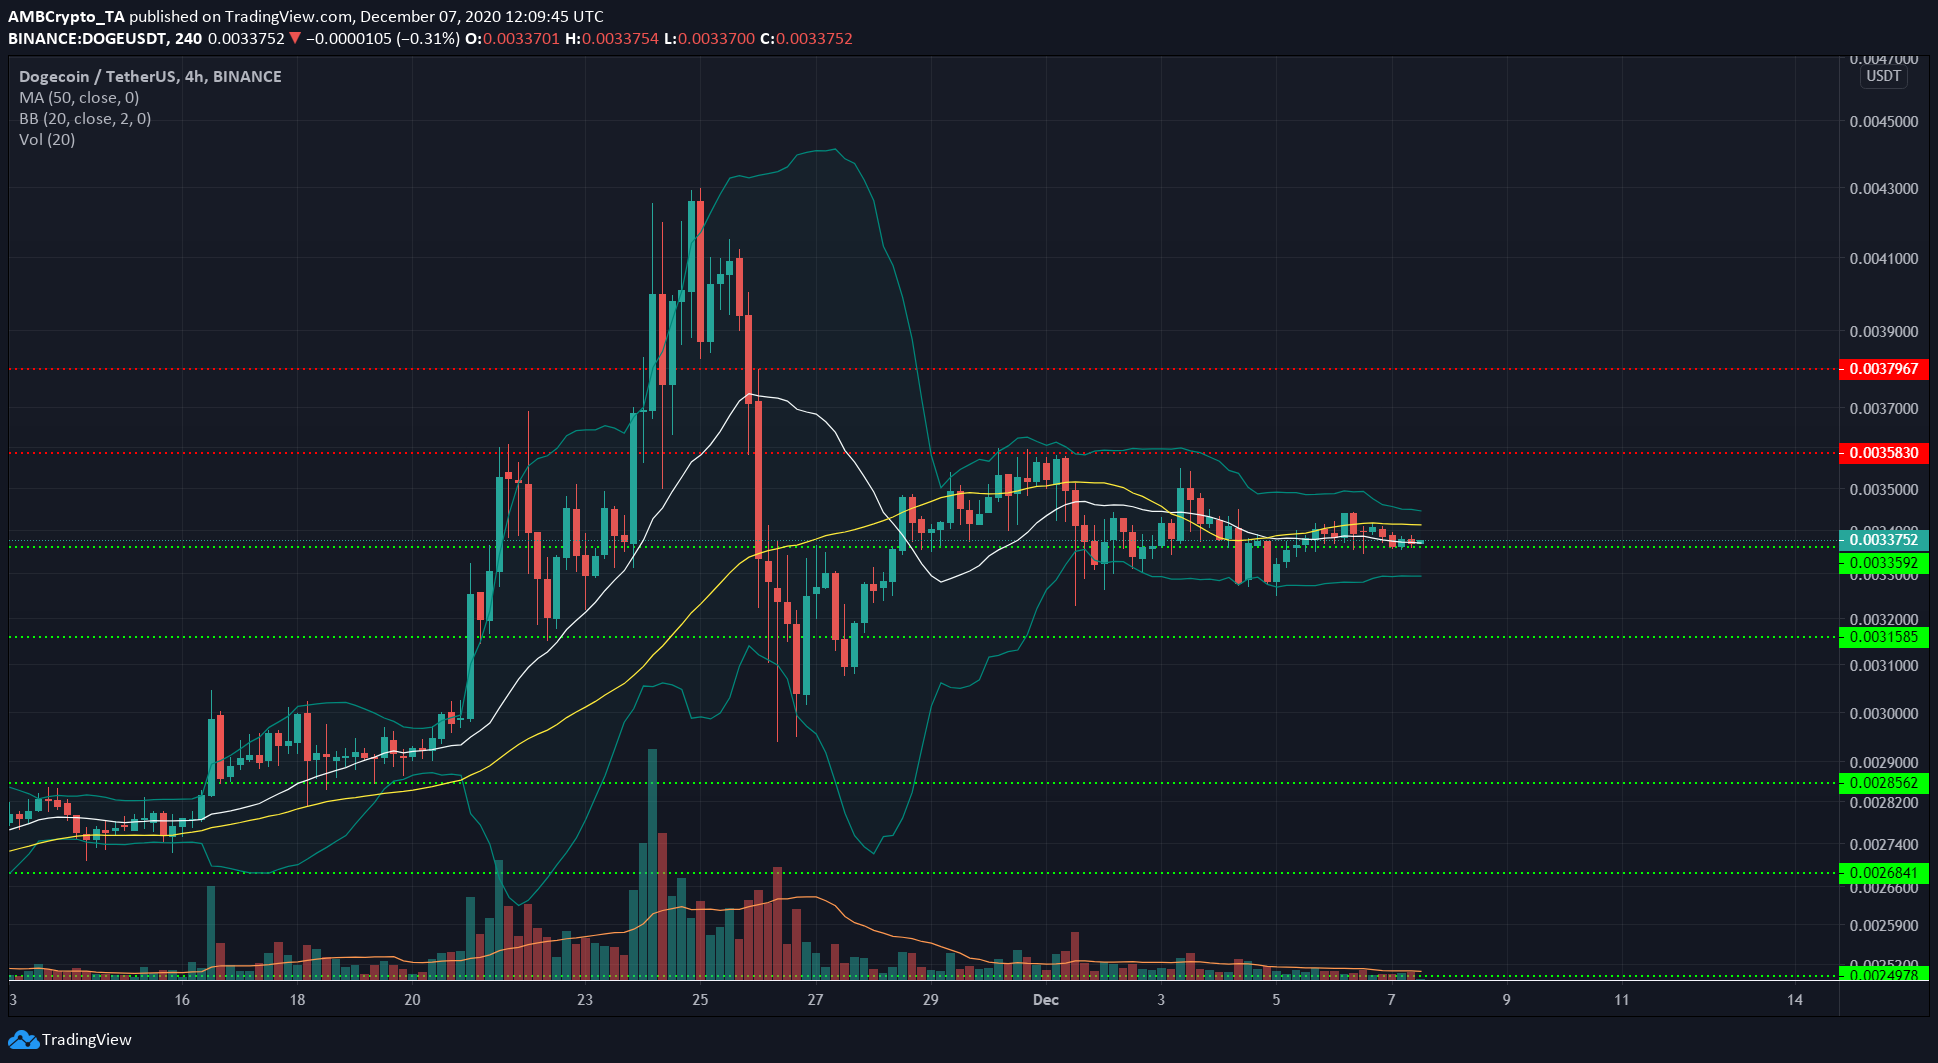
Source: DOGE/USDT on TradingView
The Bollinger Bands showed that DOGE was experiencing a period of lowered volatility. The moving averages also told the same story.
The 50 SMA (yellow) and the 20 SMA (white) were observed to be moving in close proximity for a couple of days. This indicated that the price was consolidating above the level of support at $0.0033.
The trading volume was also quite low, corroborating the notion of consolidation on the charts.