
Besides Bitcoin, all the major altcoins were undergoing severe corrections over the past 24-hours and it seemed like the depreciation was only going to get worse from here onwards. Bitcoin saw its price rise by over 1.6 percent in the past 24-hours and is now trading at $10,871.
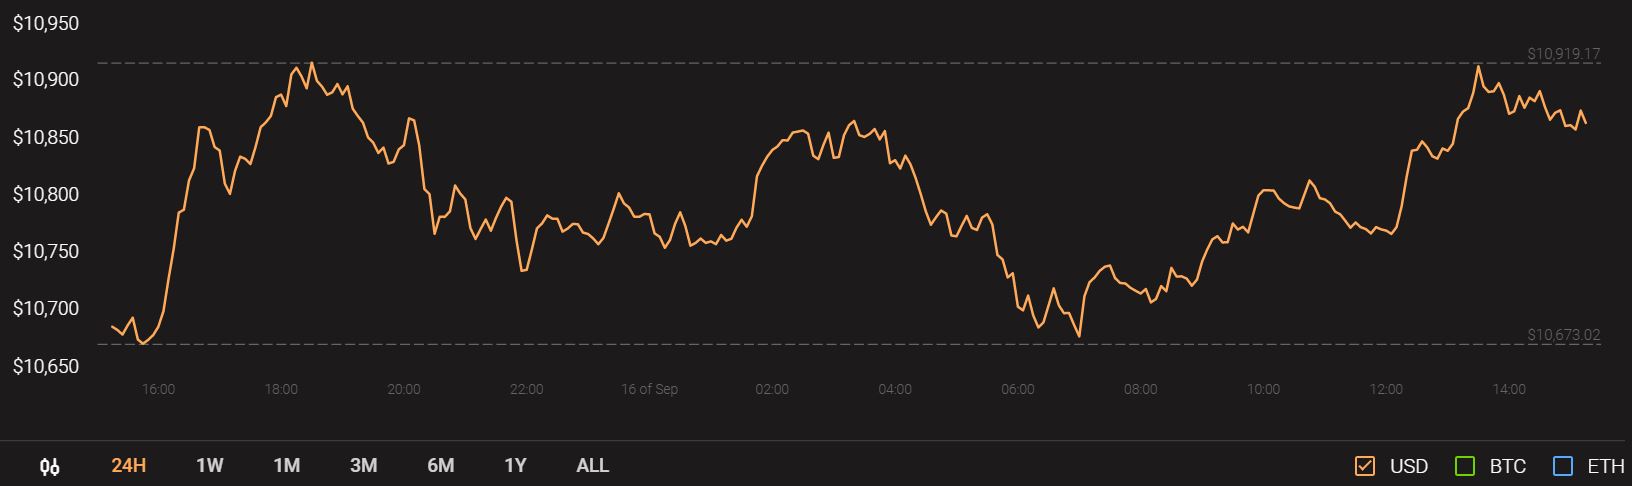
Source: CoinStats
The likes of Bitcoin SV, Stellar and VeChain also displayed decline over the past few hours, riding with the bears from the time being.
Bitcoin SV [BSV]
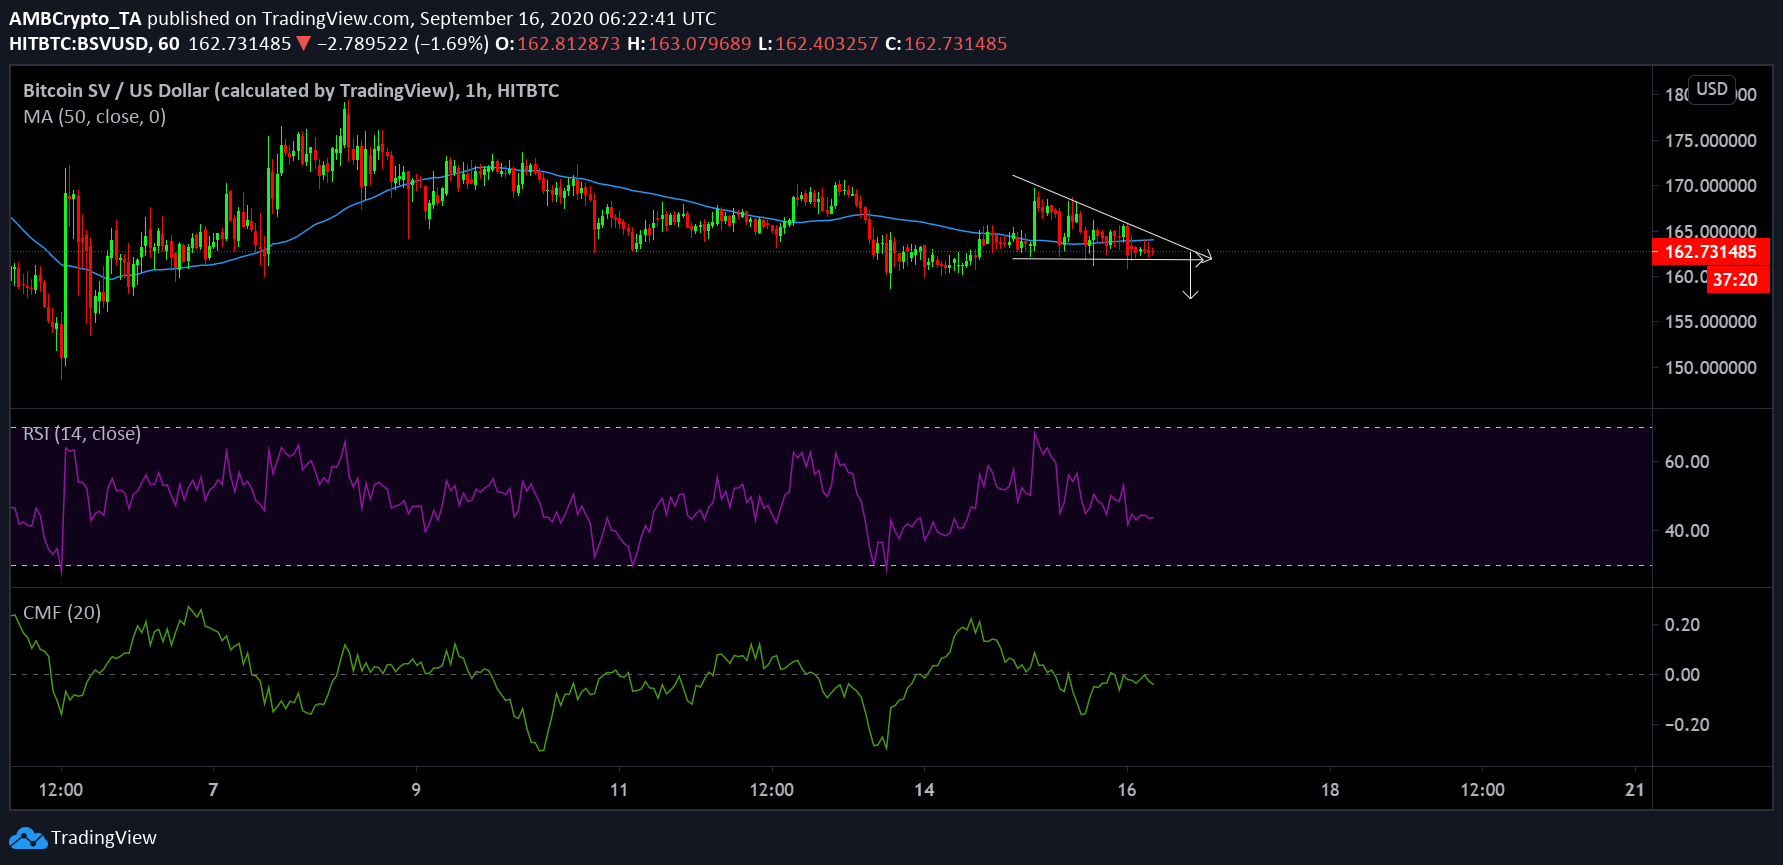
Source: BSV/USD on Trading View
The price of Bitcoin SV has been deteriorating ever since it fell below $200. The asset has been trying to maneuver up but the selling pressure has been intense for BSV. At press time, the token represented a descending triangle pattern, which suggested further bearish movement.
Bitcoin SV had a market cap of $3.01 billion at press time with a consistent trading volume of $1.11 billion over the past day. The 50-Moving Average remained as an overhead resistance on the 1-hour chart.
Relative Strength Index or RSI was indicative of rising sell pressure in the charts and Chaikin Money Flow or CMF suggested that the capital inflows were starting to drop with capital outflows increasing in the charts.
Stellar [XLM]
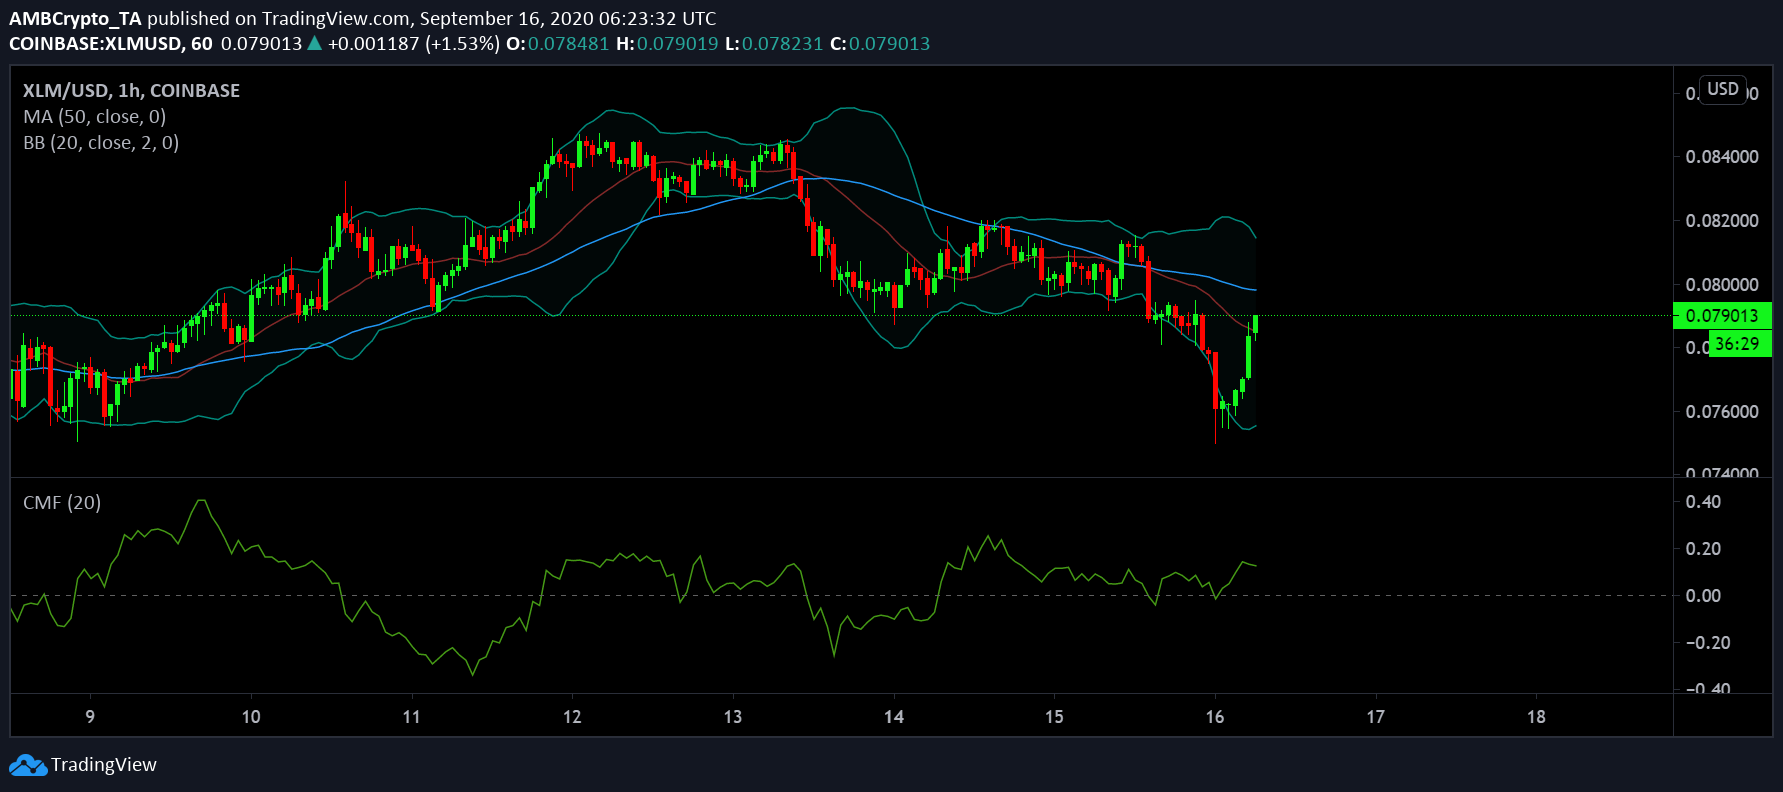
Source: XLM/USD on Trading View
Now over the past day, Stellar has slipped by 2.58 percent in the charts but over the last few hours, it seems that XLM is trying to stage a comeback. The 17th ranked crypto asset is trying to move above the 50-Moving Average but that seems unlikely at the moment. With a market cap of $1.62 billion in the chart, XLM’s trading volume over the past day was extremely low at $178 million.
XLM’s Bollinger Bands suggested higher volatility at press time but the bands appeared to converge at press time, suggestive of a reduced volatile period over the next few hours. However, Chaikin Money Flow or CMF suggested that the capital inflows continued to rise in the charts and remained a step ahead of capital-outflows.
VeChain [VET]
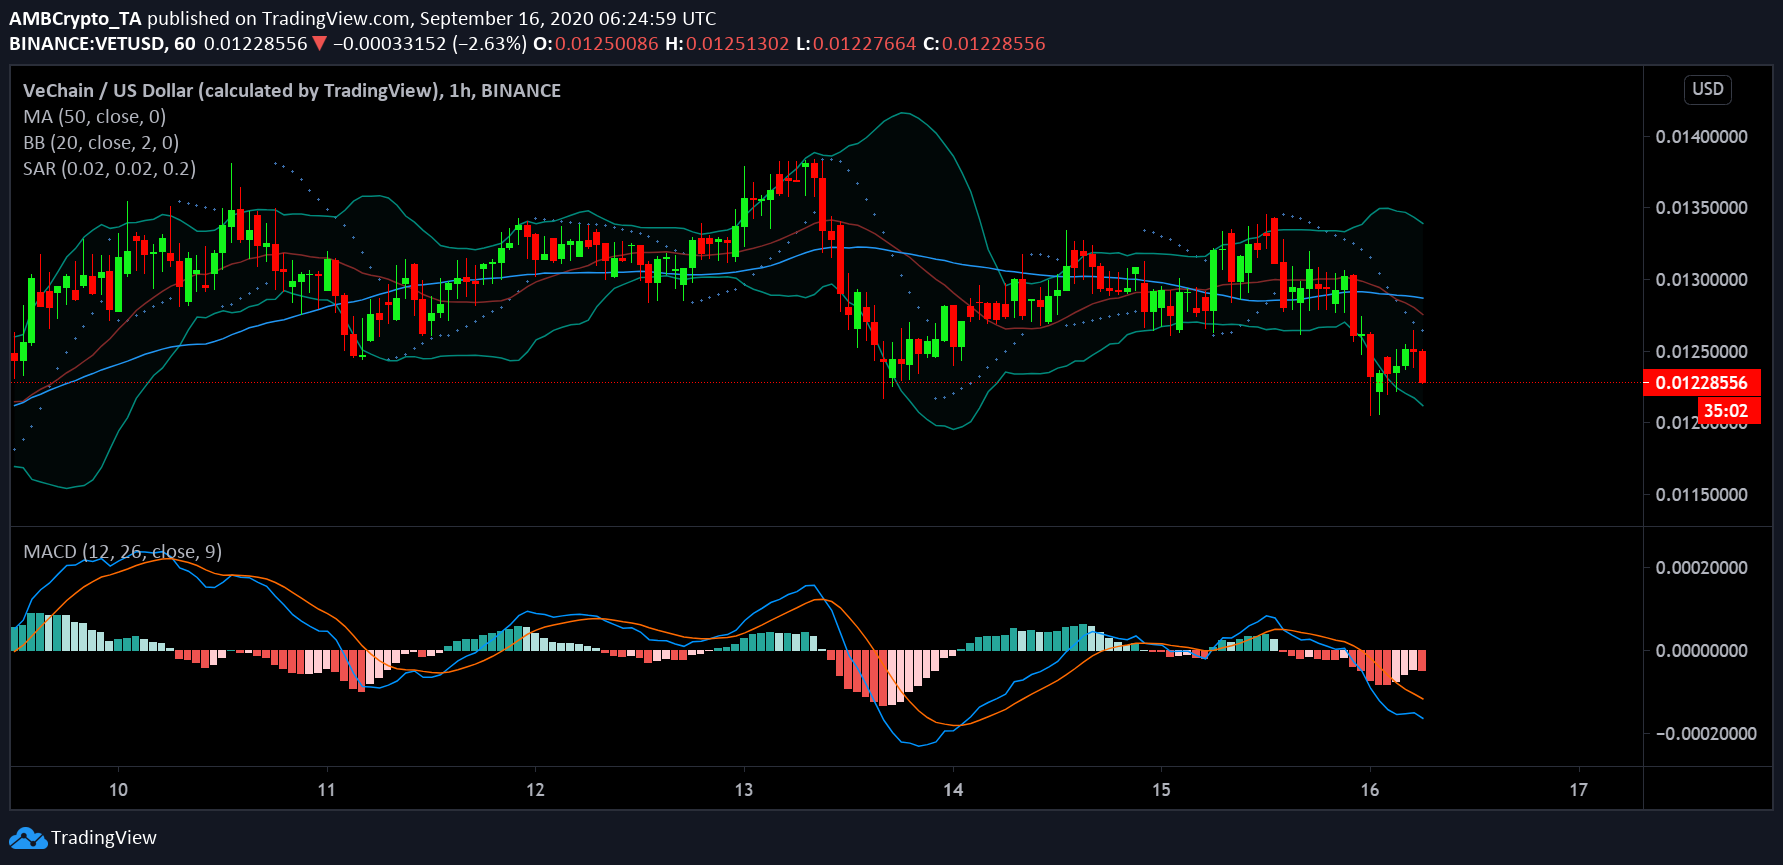
Source: VET/USD on Trading View
Lastly, VeChain exhibited a decline of 3.59 percent in the market, which was tagged along with a market cap of $796 million. VeChain was ranked 26th in the charts as the token continued to suffocate under bearish momentum. With the price falling down to $0.0122 at press time, its market cap remained at $796 million with a trading volume of $146 million.
Market Indicators were bearish in unison as well. MACD line hovered under the signal line indicating strong bearish pressure while Parabolic SAR dotted line remained above the candlesticks. Bollinger Bands appeared parallel to each other, suggestive of continued volatility.