Analysis
Bitcoin SV short-term Price Analysis: 28 September

Disclaimer: The following price prediction should not be considered as investment advice.
Bitcoin SV, despite setbacks, continues to hold on to the ninth rank on the cryptocurrency charts, managing to keep itself within the market’s top-10. However, with DeFi coins gaining more traction lately, it might not be a surprise to see old cryptocurrencies slide even lower on the crypto-ladder.
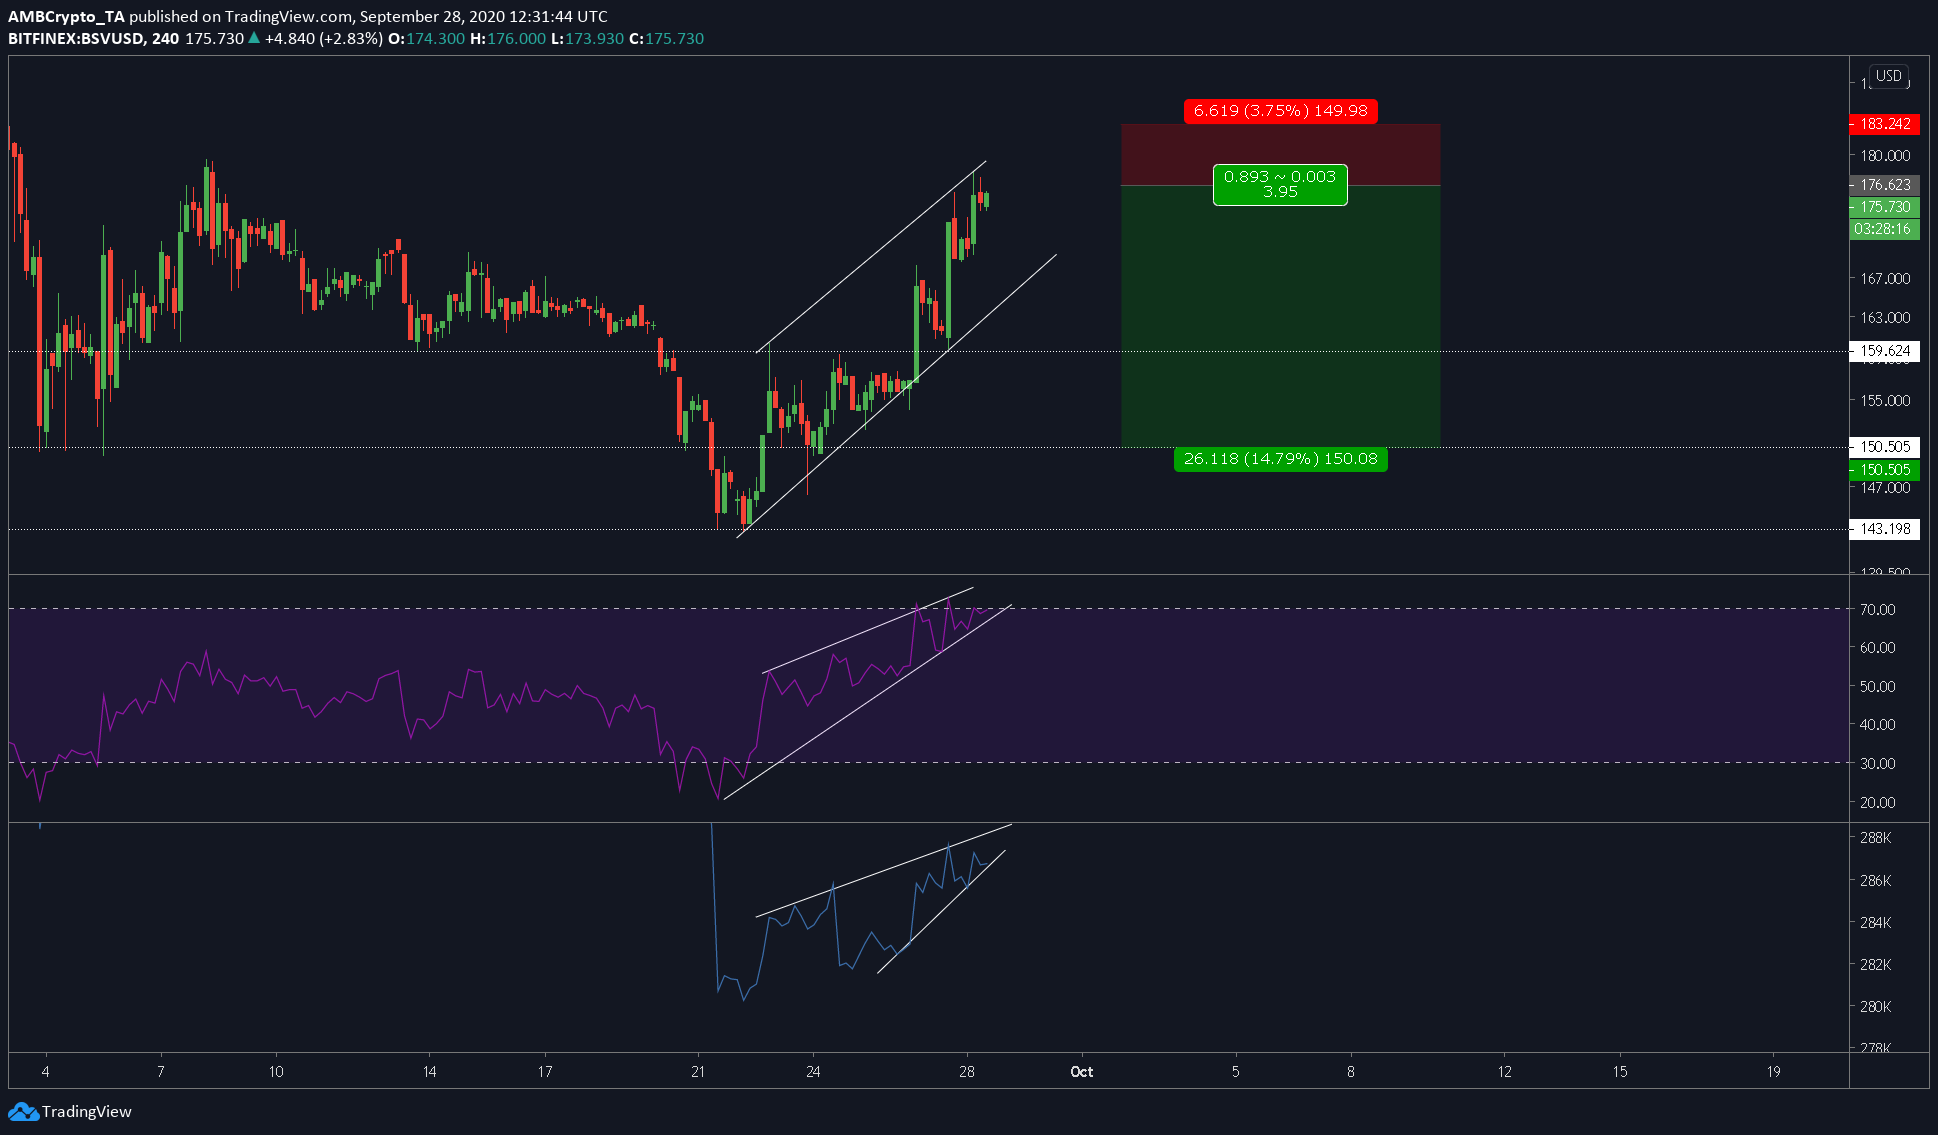
At press time, the short-to-medium term timeframe for BSV showed a bearish setup. Hence, a short would be a good take here.
Bitcoin SV 4-hour chart

Source: BSVUSD on TradingView
The ascending parallel channel may be a bearish pattern, however, all long scalps are done and the price, at the time of writing, was ready for a breakout. There are plenty of short scalp opportunities here. The first and most obvious scalp is the downtrend of the price from the top of the channel to the bottom of the channel. This will be a drop of 4.33%.
The rationale behind this trade are two indicators – RSI and OBV.
The RSI indicator was forming a rising wedge and has already been rejected thrice. Expecting a drop in RSI towards the neutral and perhaps, the oversold zone, might also be possible as this trade plays out.
The OBV indicator was also highlighting a similar rising wedge. Hence, a breakout from this will fuel a drastic decrease in volume.
For this short play, the entry can be at $176 with stop-loss at $184. The take profit would be 4.33% lower at $166. The second position would be with the same entry and stop-loss, however, the take-profit would be much lower – at $159. This trade would yield an R of 2.1.
However, the actual take-profit would be at $150.50 with an R of 3.22. Letting the price play out after this with trailing stop-loss would be the best option to maximize profits.
In total, this short position would yield a 14% drop with a risk of 4.5%. This also coincides with a drop in Bitcoin and Ethereum on the long-term timeframe.

