Bitcoin SV short-term price analysis: 24 August

After consolidating for a good three weeks above $200, Bitcoin SV finally dropped below long-term support on 21 August. The depreciation seemed inevitable over the past week, as a consistent array of price drops led to BSV’s new price range. With a market cap of $3.67 billion, the asset is currently in close proximity with the resistance at $199, as BSV was valued at $198.63.
Bitcoin SV 1-hour chart

BSV/USD on Trading View
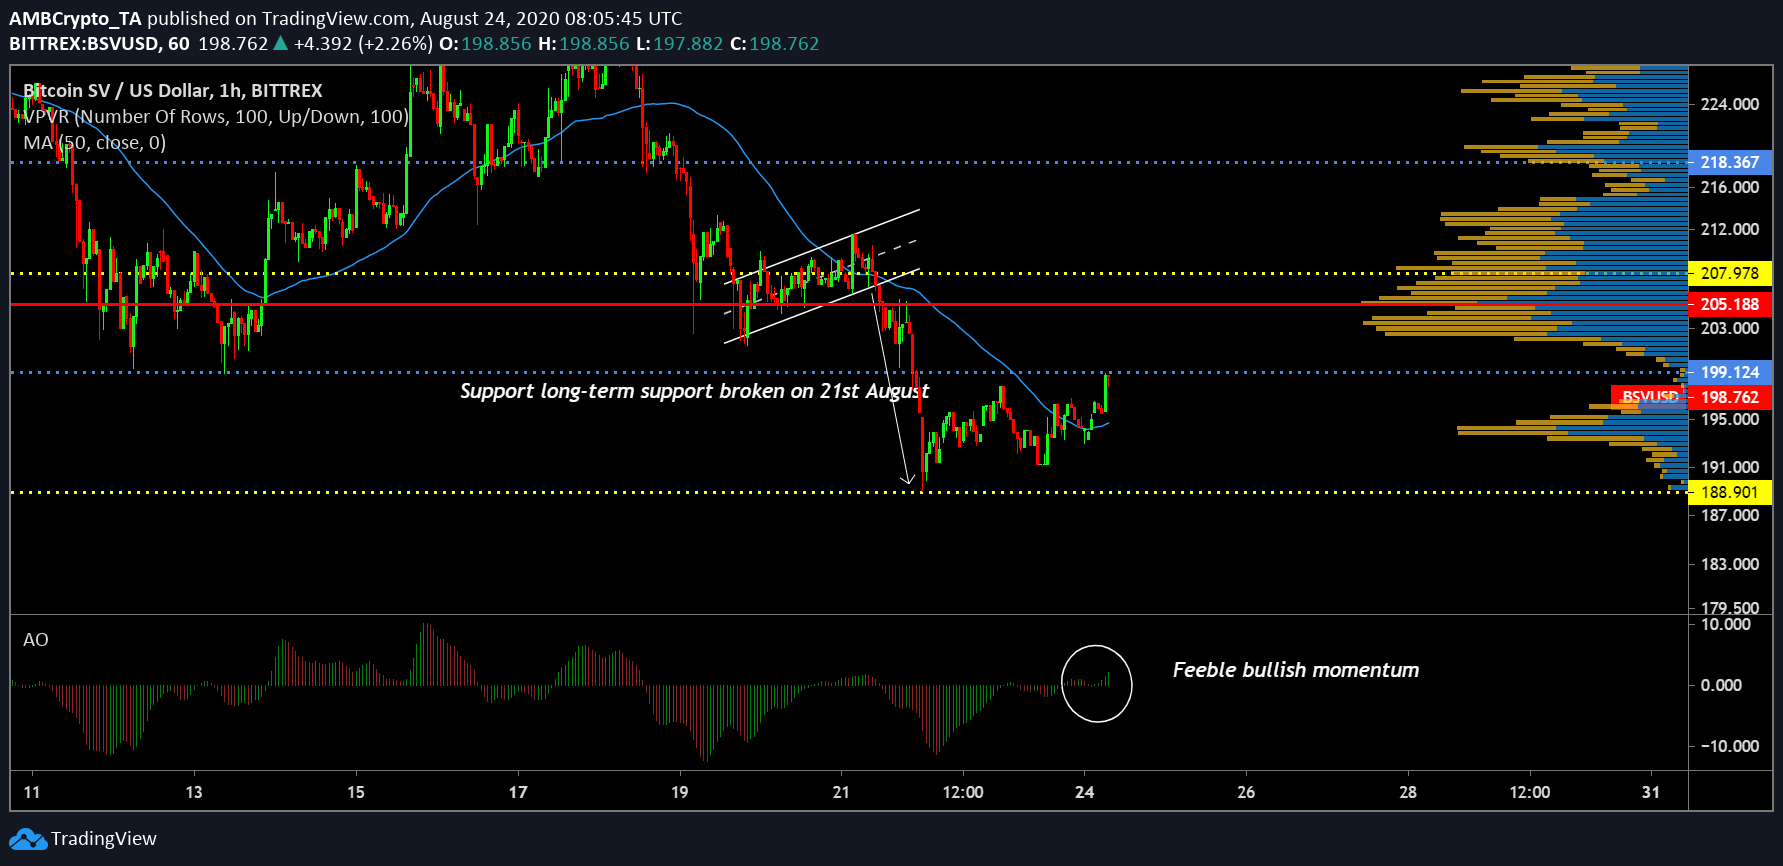
The 1-hour chart clearly identified the series of events that took place over the past few days. After registering a sharp drop from $218, Bitcoin SV tried to maintained sideways movement between the price range of $203-$210, but its movement gave rise to an ascending channel. With strong bearish implications, the price inevitably faced another pullback at the asset’s value dropped below $199.
It has to be noted that the coin dropped from a range of significant trading volumes which indicated that selling pressure was extremely high during the dip. Bitcoin SV dropped down to as low as $188, but now the asset has recovery back to $198.
At the moment, the market indicators were contradictory to BSV’s movement. With 50-Moving Average turning into strong support once again, there was a possibility that the price may bounce back above $199 once again. However, Awesome Oscillator exhibited feeble bullish momentum projected, which is probably not enough to rally past the resistance.
With VPVR suggesting low trading volume at the current range, another drop to $192-$190 looks likely.

BSV/USD on Trading View
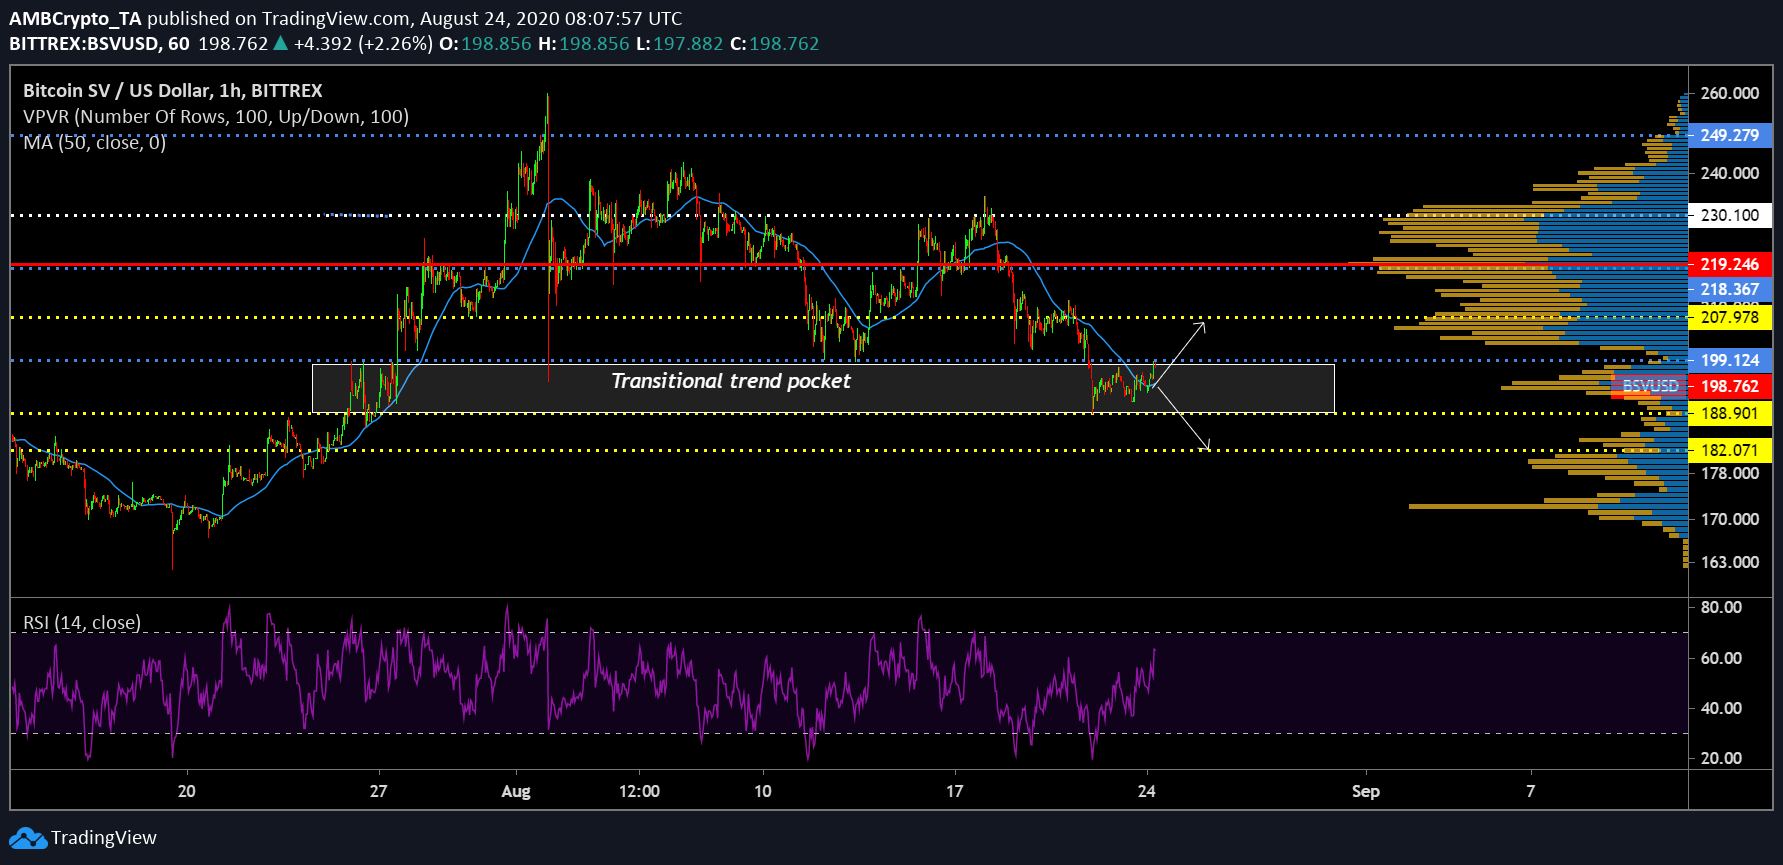
Bitcoin SV is currently in a transitional trend pocket. In the past, the asset has moved upwards from here on, which opens BSV’s chances of re-testing the range above $199 again. However, it seems like the asset is entering the end of the bullish rally for now, and a drop to $182 over the next few days has a higher probability.
With Relative Strength Index reaching a saturation point with buying pressure, Bitcoin SV’s decline over the next few days looks pre-destined.
Disclaimer: The following price prediction should not be taken as investment advice. The prediction should materialize within the next 24-48 hours.


