
Disclaimer: The following price prediction should face a transition over the next week.
With the collective market extremely bullish, it was unlikely for the top altcoins to not join in the rally. The overall market for Bitcoin SV was positive with the asset registering a spike of 2.42 percent over the past day. However, for BSV the major development was the breach above resistance $197 for the first time since the 1st week of June.
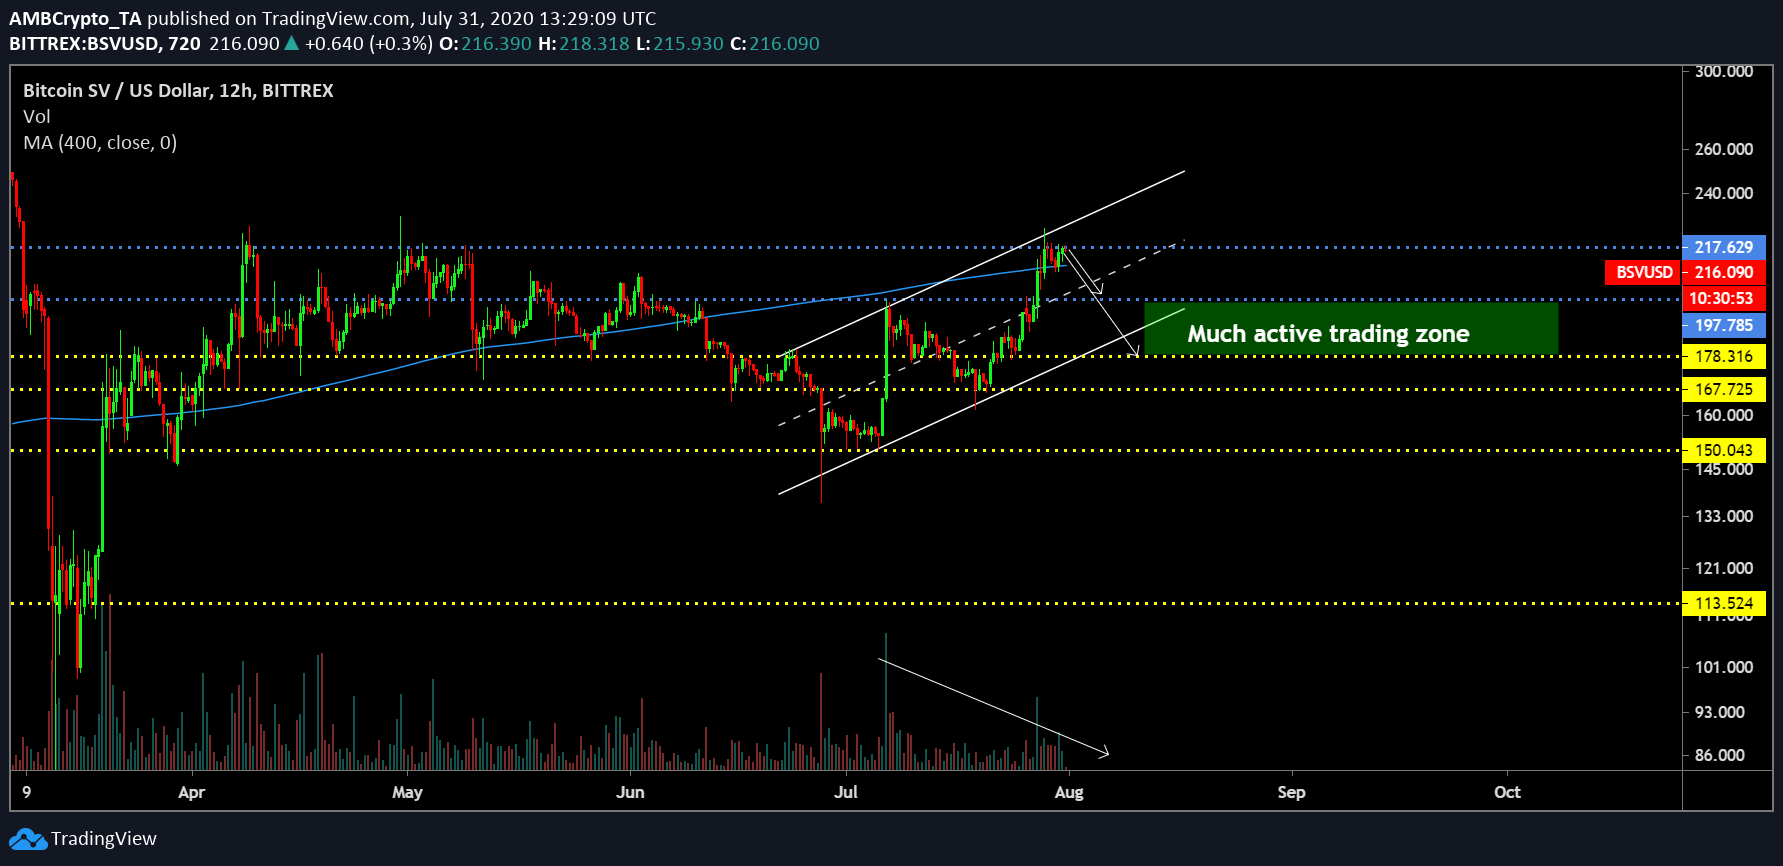
BSV/USD on Trading View
From the 12-hour chart, It can be observed that Bitcoin SV has been oscillating between the trendlines of an ascending channel since mid-June 2020. A bearish breakout was supposed to take place beforehand itself, but the price has managed to remain above the long-term resistance at $197. However, the valuation continued to mediate within the parallel channel. Although the pattern would not go under a bearish break unless the token dives below $180, there is a chance of a pullback down to $197 over the next week.
For Bitcoin SV, one thing is for sure, it will not have any market trigger point to push forward with bullish momentum. The asset is solely rising on the back of the collective market, hence as the bullish rally subsides in the industry, BSV is likely to falter as well.
With the trading volume decreasing in the charts, it is pointing towards a significant bearish divergence as the price continues to hold under the resistance at $217.
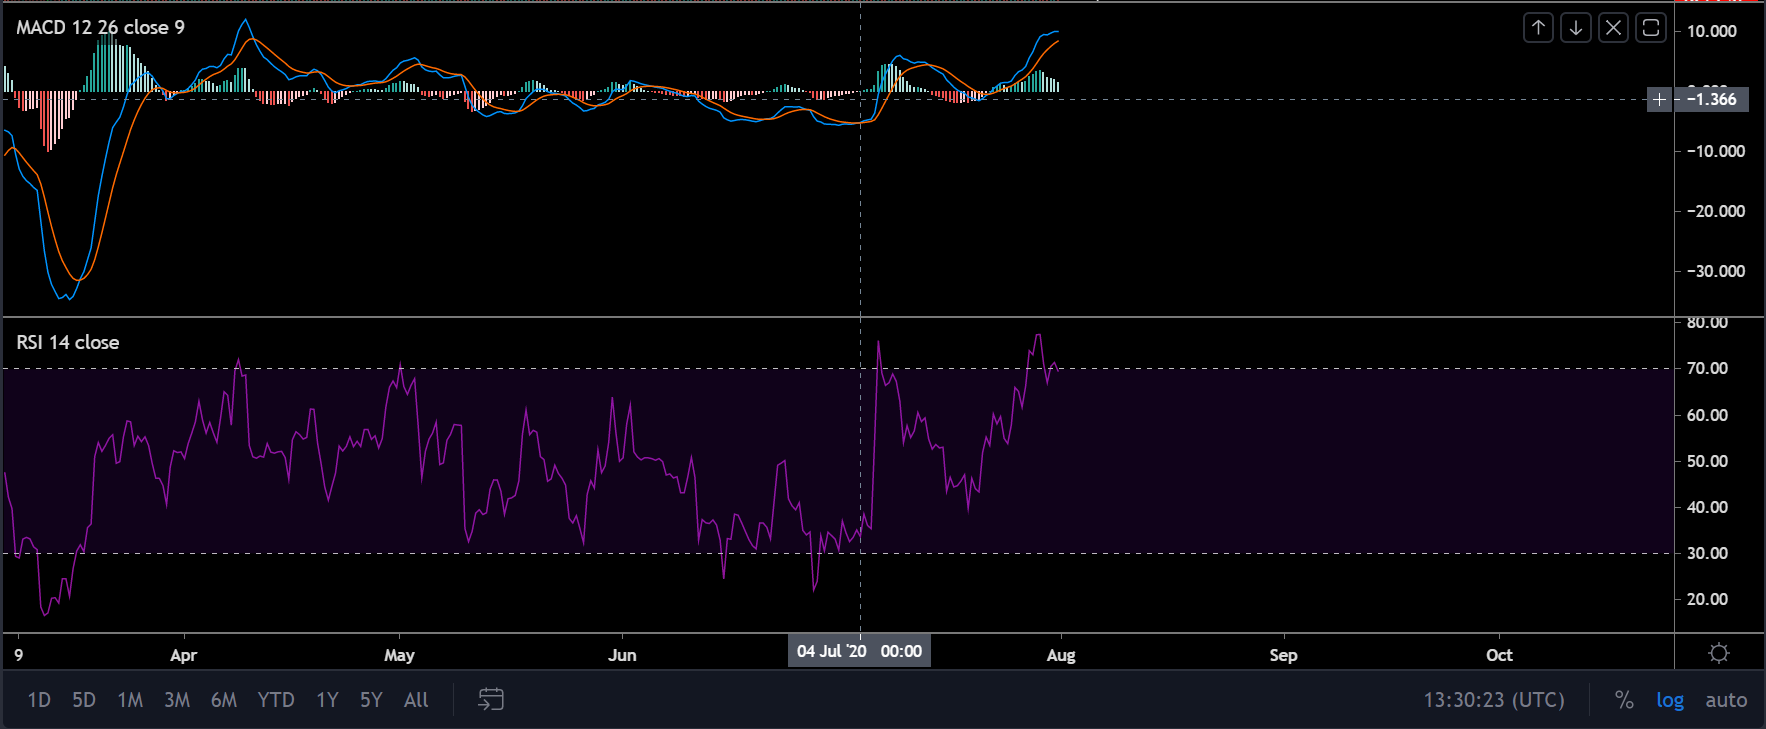
Source: BSV/USD on Trading View
According to market indicators, MACD is slowly sliding towards a bearish turnover with the blue line noticeably moving towards the red line.
Relative Strength Index or RSI is also indicative of a downtrend as the market begins to slide below the overbought zone.
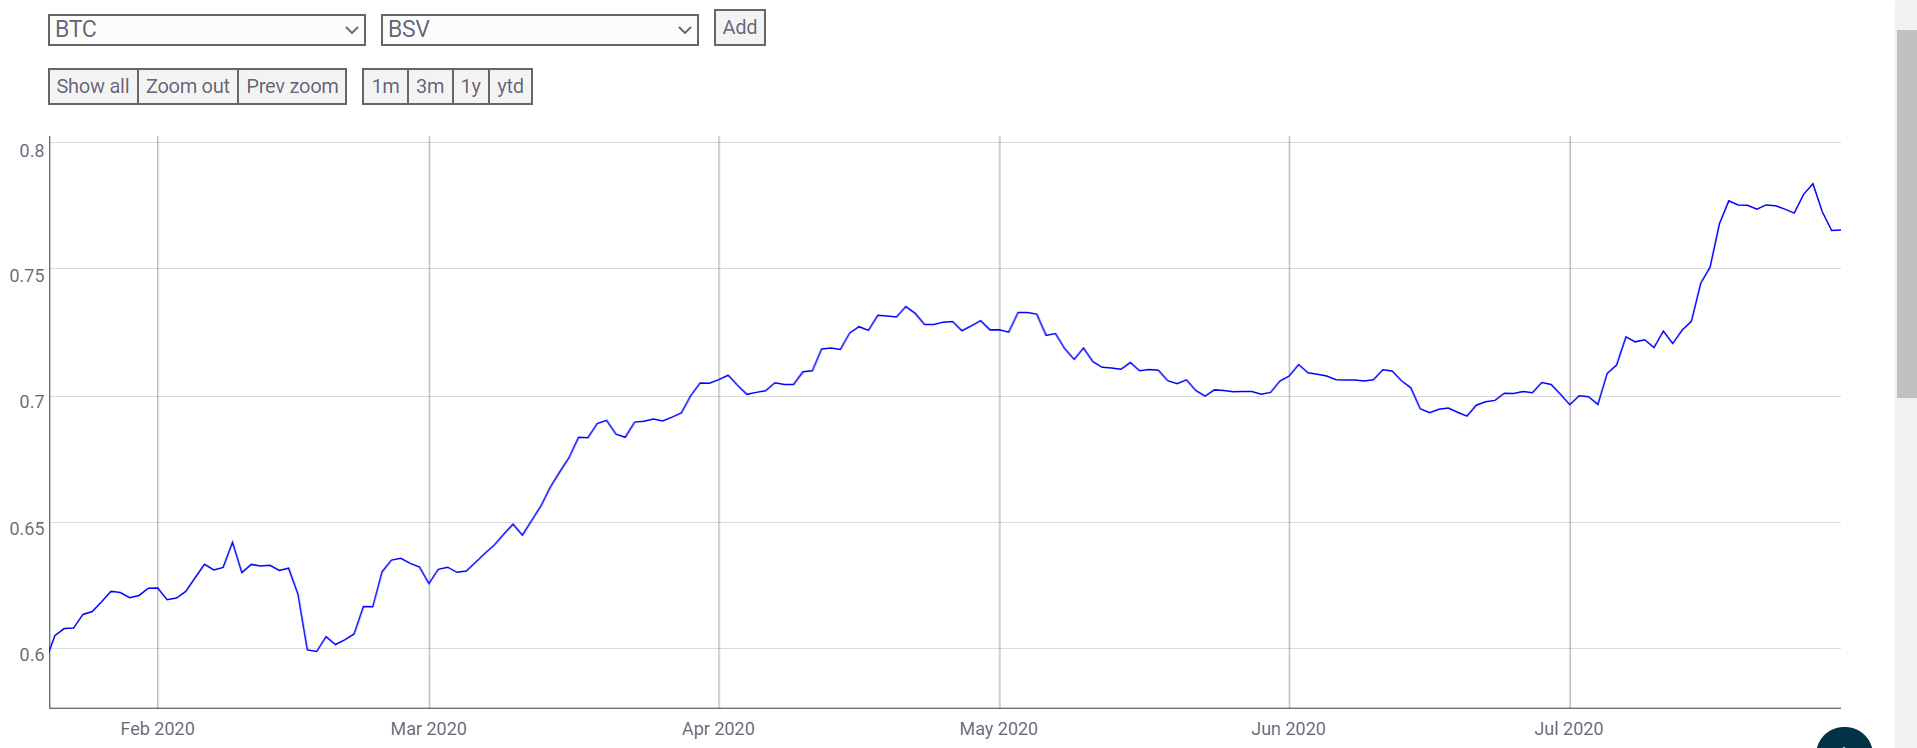
Source: Coinmetrics
The inability of Bitcoin SV to hold its own market is evident in the correlation charts. Since the start of July, correlation with Bitcoin has risen from 0.69 to 0.76 between both the assets. Bitcoin usually incurs a lot of dominance over the rest of the market, which is clearly observed in the above chart.
Conclusion
For Bitcoin SV, a break above $217 will be extremely positive but seems a little unlikely considering the fact that the momentum is dependent on other assets. An eventual decline down to $197 is expected in the next week.