Analysis
Bitcoin SV long-term Price Analysis: 26 October

Disclaimer: The findings of the following article are the sole opinion of the writer and should not be taken as investment advice
While Bitcoin rallied above $13,000 once again, at press time, a few other altcoins were also making a dash for their immediate resistance levels. 10th-ranked Bitcoin SV’s price rose by 12.46 percent over the past one week, with a relatively high spike of 4.36 percent over the past 24 hours. However, the rally might note a period of turbulence soon.
Bitcoin SV 12-hour chart

Source: BSV/USD on Trading View
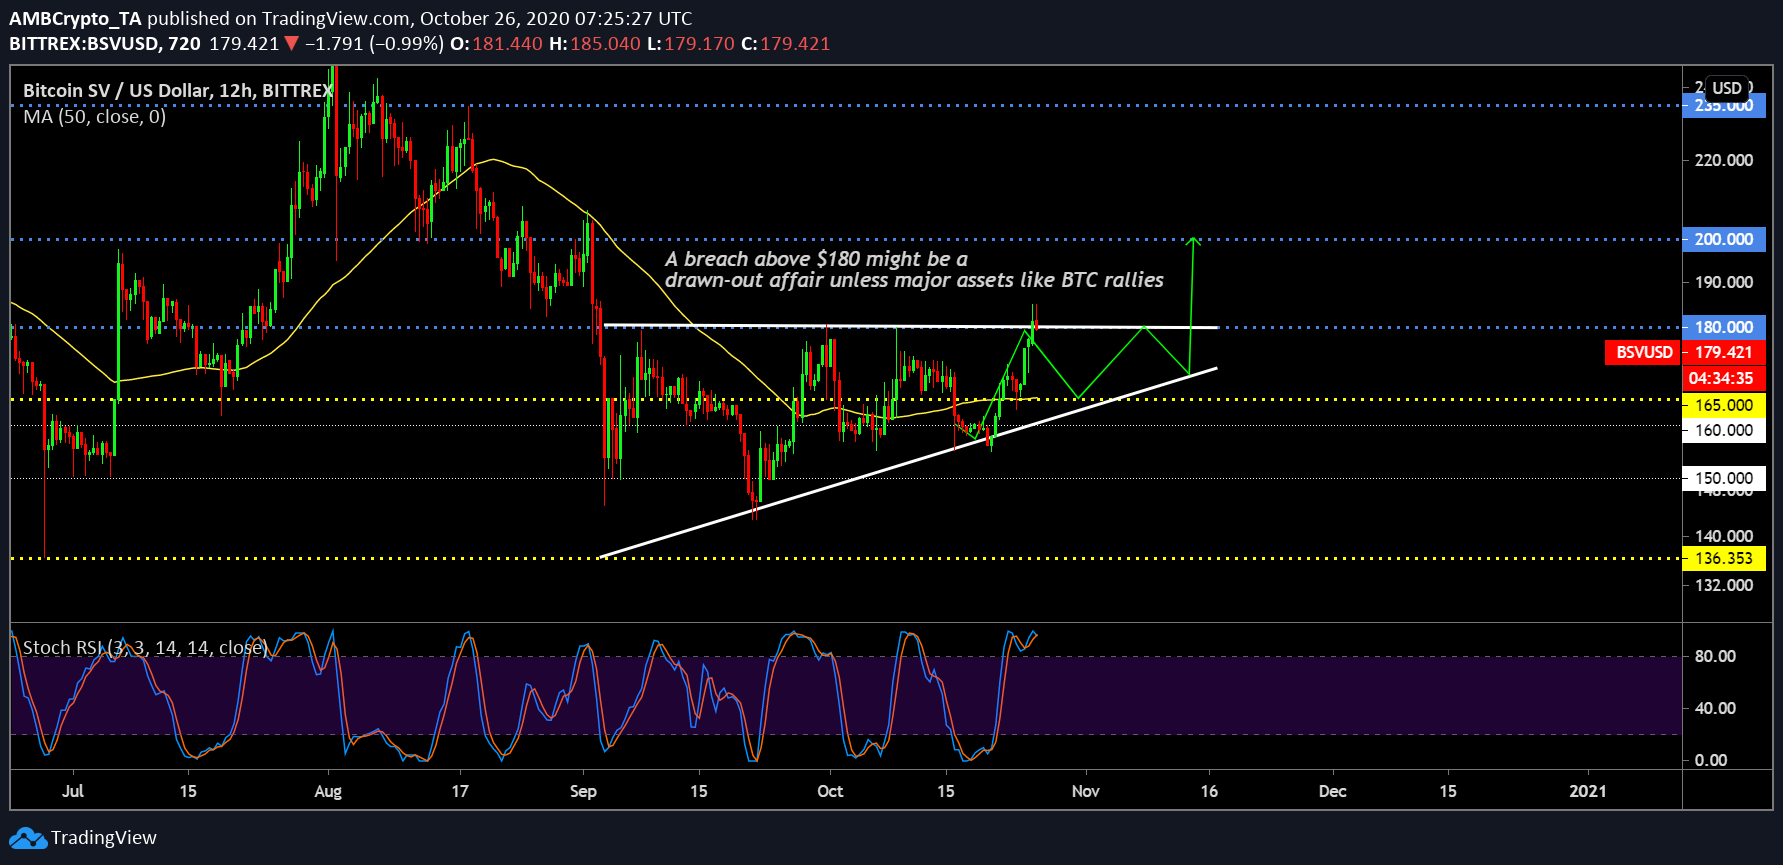
At the time of writing, the 12-hour chart for Bitcoin SV was keeping up with the ascending triangle pattern and it seemed like the eventual breakout above $200 might take a while. As identified by the chart, the price did register a re-test of the parallel trendline of the pattern, but it did not complete a complete breach. With the price hovering right under $180, at press time, there was a high chance that the price would attain a breakout from the ascending triangle over the next few days, but the turnaround can be more drawn out as well.
At the time of writing, Bitcoin SV was receiving the underlying support of the 50-Moving Average, but a retest at $165 remained a possibility.
According to Stochastic RSI, the breakout downwards might surface within the next few days as the bearish indicator closes in on a crossover with the bullish line in the overbought zone.
Bitcoin 1-day chart
Source: BSV/USD on Trading View
The 1-day chart for Bitcoin SV highlighted a rising wedge pattern, one that falls in line with the eventual bearish movement. While the breakout from the pattern might not take place over the current week, a pullback under $170 should unfold soon.
The price range between $180 and $170 appeared crucial as the crypto-asset has hardly noted higher consolidation at this range.
Finally, the On-balance volume, at press time, was dropping below the neutral zone, hence, the retail side might be exiting the market as strong hands might need to dip in again to pump the price. Speaking about volume, trading volume was extremely minimal as well, keeping the price movement highly volatile and unsure.

