
Bitcoin SV’s fortunes don’t seem to be getting any better as the year progresses. Its press time trading price was a far cry from its early-2020 valuation after it seemingly peaked in August. Following the same, BSV has continued to depreciate over the past few months. However, the question still remains – Can the cryptocurrency that once occupied a spot at the top salvage the rest of the year to return to form?
At press time, Bitcoin SV was being traded at $167 with a market cap of just over $3 billion. Interestingly, over the past week, a minor gain of 4.7 percent did see BSV rise on the charts.
Bitcoin SV 1-day Chart
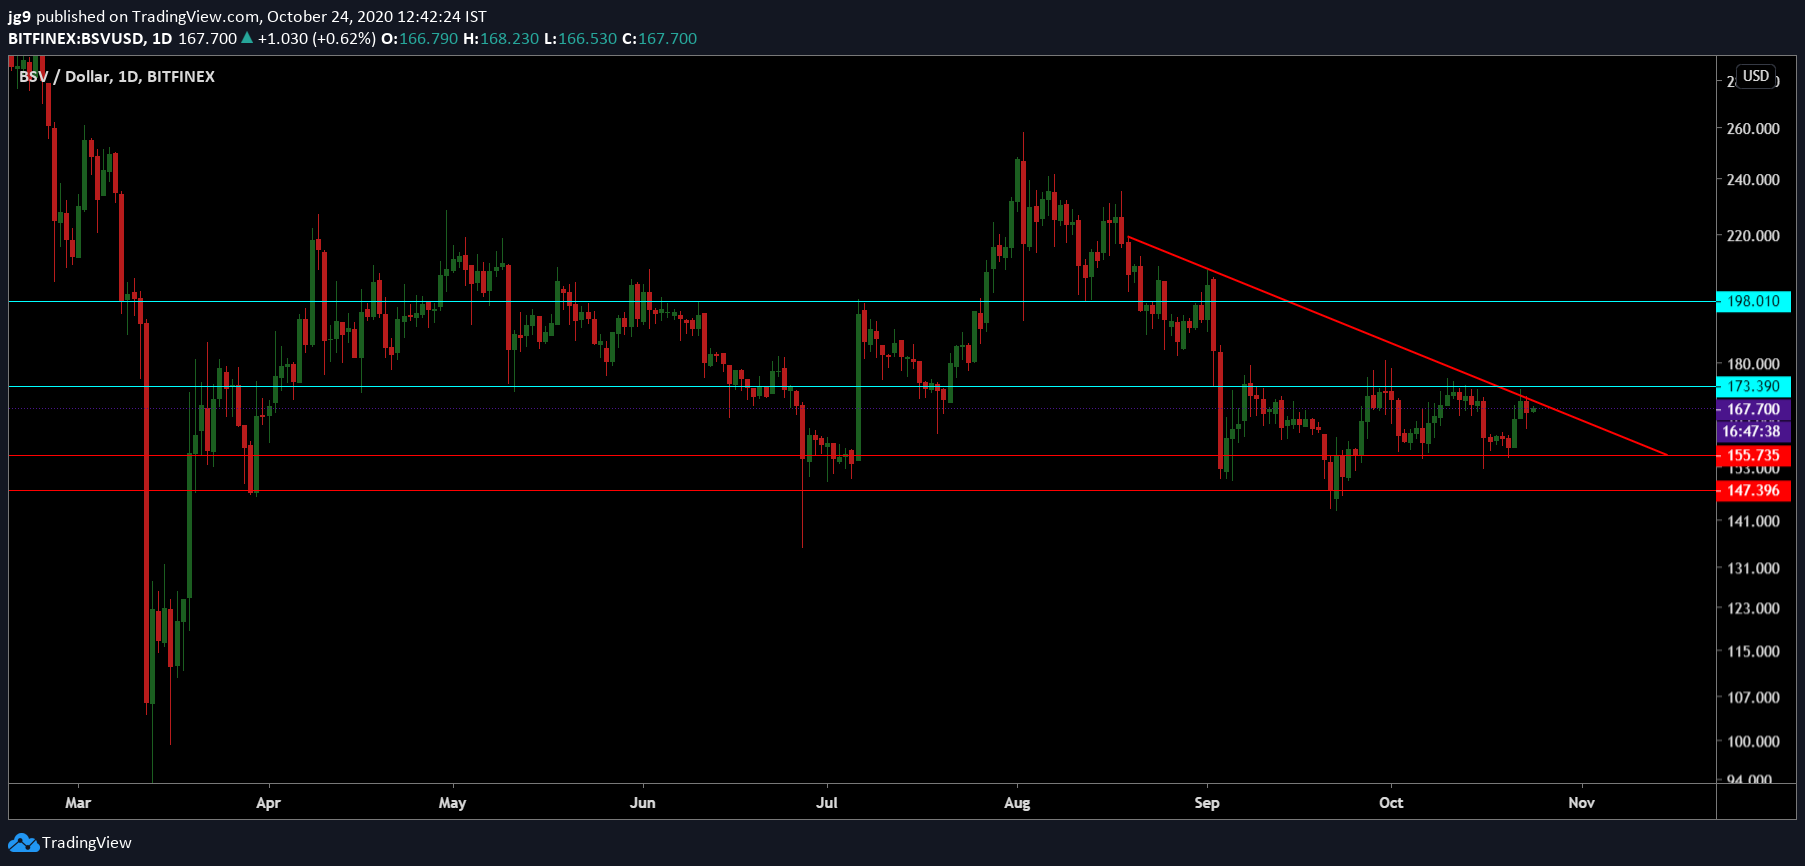
Source: BSV/USD, TradingView
On observation of Bitcoin SV’s daily chart, it was evident how the coin has been on a steady downtrend since August, with its price action confined within a descending triangle formation. During this period, BSV’s price traded roughly around the $173 and $155-price levels. In the case of a descending triangle formation, the breakout is normally bullish, which would mean yet another recovery run for BSV. In such a scenario, the likely destination for BSV’s price is the resistance at $173.
However, given its price action and the fact that a breakout is still a little far away, the coming week is likely to see the coin remain within the formation and head towards the support at $155. If BSV’s fortunes take a turn for the worse, there is one more support that the coin can rely on at $147 that can help stabilize the coin’s price.
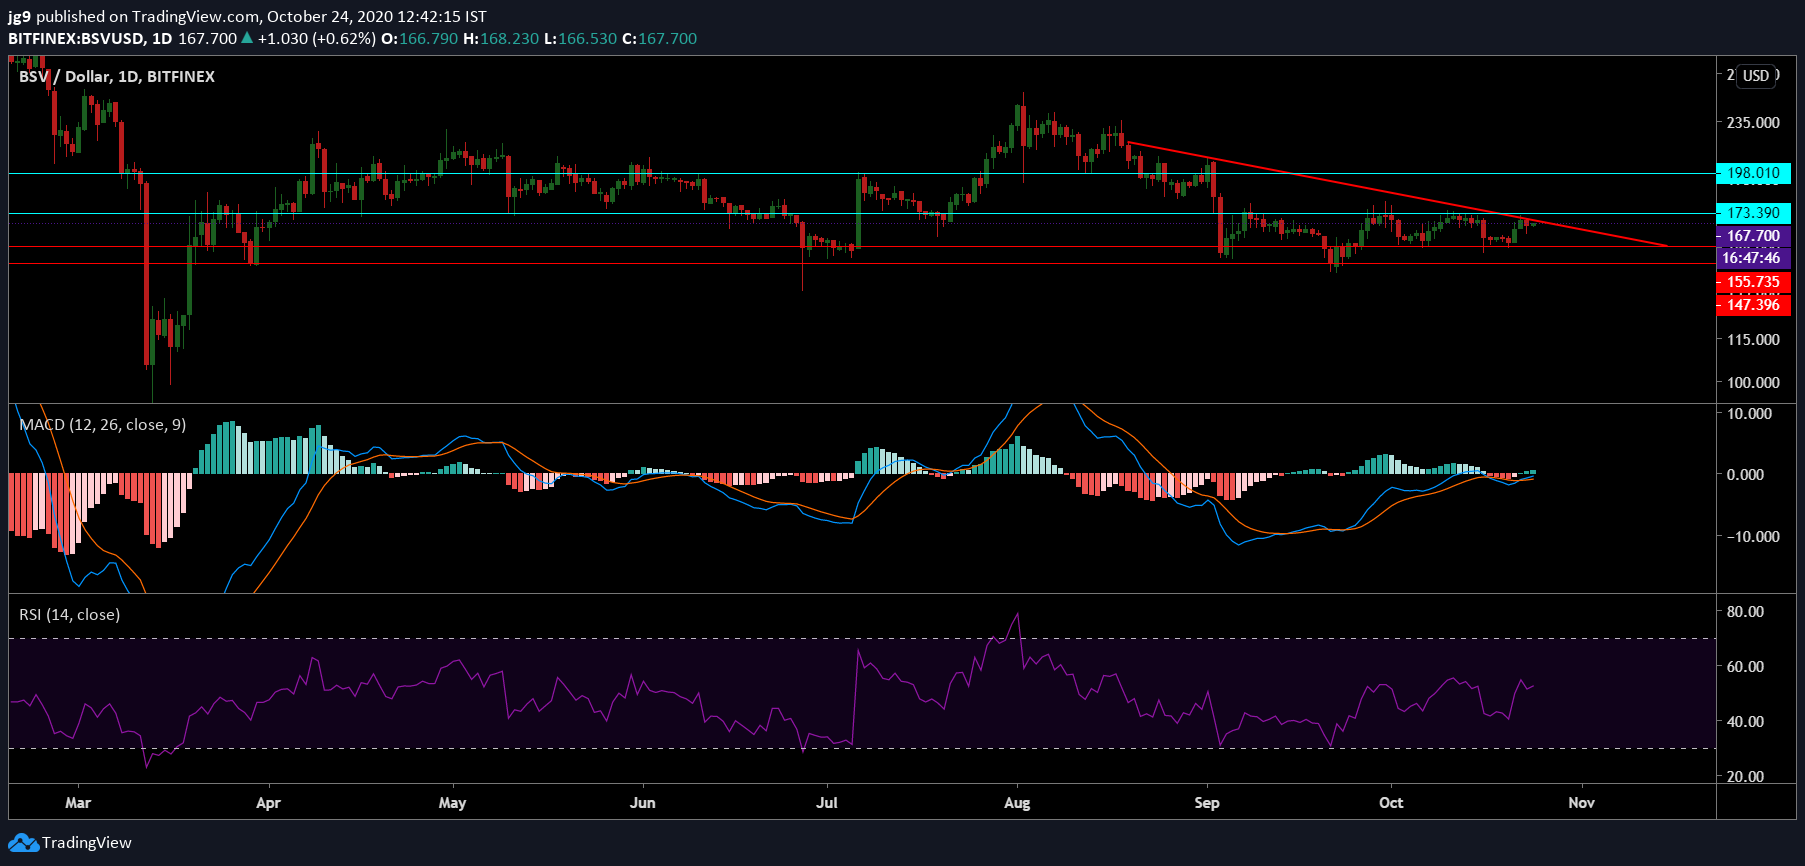
Source: BSV/USD, TradingView
Interestingly, the situation seemed a lot more promising as per BSV’s technical indicators. The MACD indicator had undergone a bullish crossover and if the bullish momentum prevails, the breakout may happen soon. The RSI echoed a similar sentiment as it had positioned itself closer to the overbought zone.
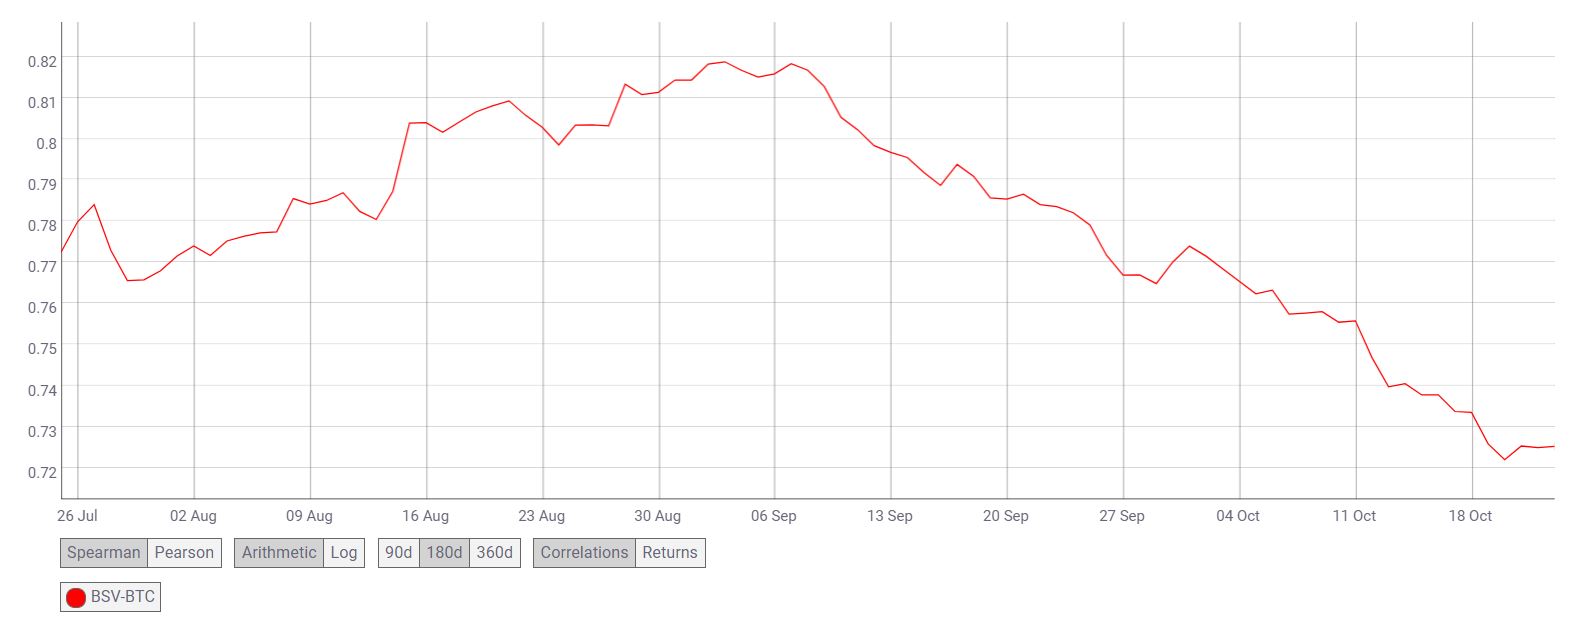
Source: CoinMetrics
Akin to a few other altcoins, BSV too has demonstrated that it is capable of price movements independent (To a certain degree) of Bitcoin. In fact, the past 3 months have reflected the same, with its correlation falling to 0.72, as per CoinMetrics’ chart.
Conclusion
Bitcoin SV’s price, after having been confined to a descending triangle formation, may attempt a breakout if the bullish sentiment prevails. This would take the coin to its immediate resistance at $173 in the coming week. However, if the coin’s price action remains within the formation, then a dip to $155 to $147-price levels cannot be discounted.