
Disclaimer: The following price prediction should not be taken as investment advice as it is the opinion of the writer.
The market of Bitcoin SV is clinging onto Bitcoin at the moment. As Bitcoin sustained its position above $10,900 for the time being, BSV also appeared to maintain close proximity to the resistance at $165. However, time is running out for both Bitcoin and Bitcoin SV, and for the latter, the breakout is going to pretty significant.
Bitcoin SV 6-hour chart
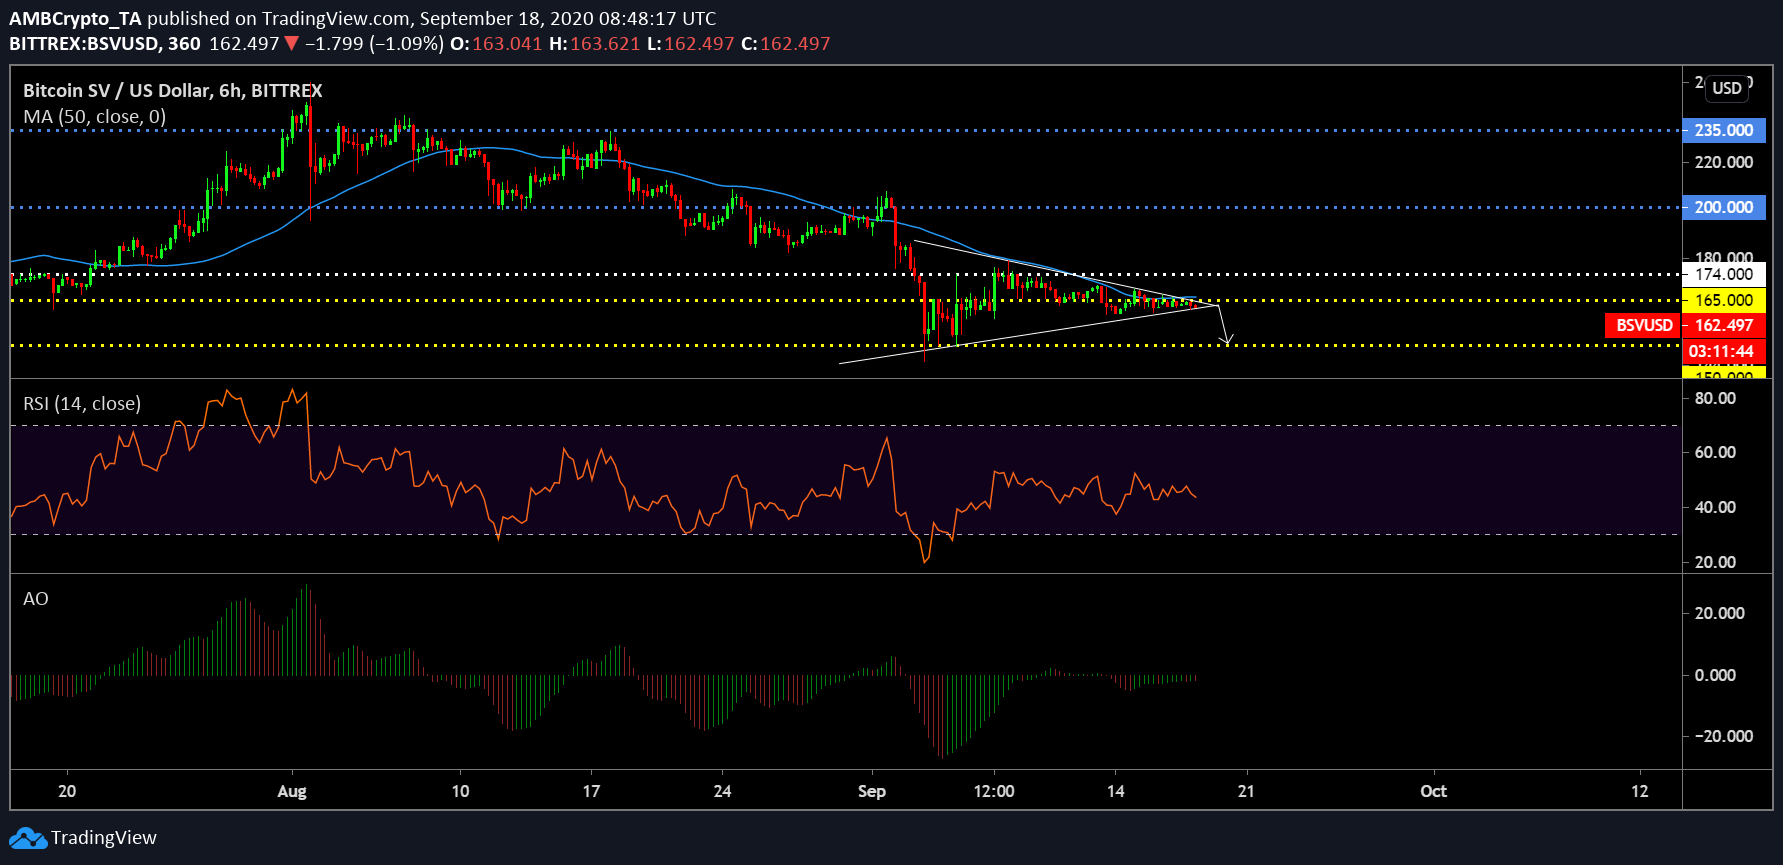
Source: BSV/USD on Trading View
As explained earlier, Bitcoin SV’s past 72-hours has displayed infinitesimal price movement and the asset is currently displaying the formation of a symmetrical triangle. While a symmetrical triangle proclaims a 50-50 probability between a bullish and bearish breakout, all the signs in the charts are pointing towards a correction. Relative Strength Index or RSI is barely maintaining a neutral position with sellers continuing to exhibit high pressure.
The Awesome Oscillator or AO also suggested a similar conundrum, as the bullish momentum is all but extinguished at press time. A rise in bearish momentum was also not witnessed either so the trend might stretch for another 48-hours in a similar stagnant phase. With the 50-Moving Average acting as a strong overhead resistance, the chances of a bullish breakout continue to drop for Bitcoin SV.
Bitcoin SV 1-day chart
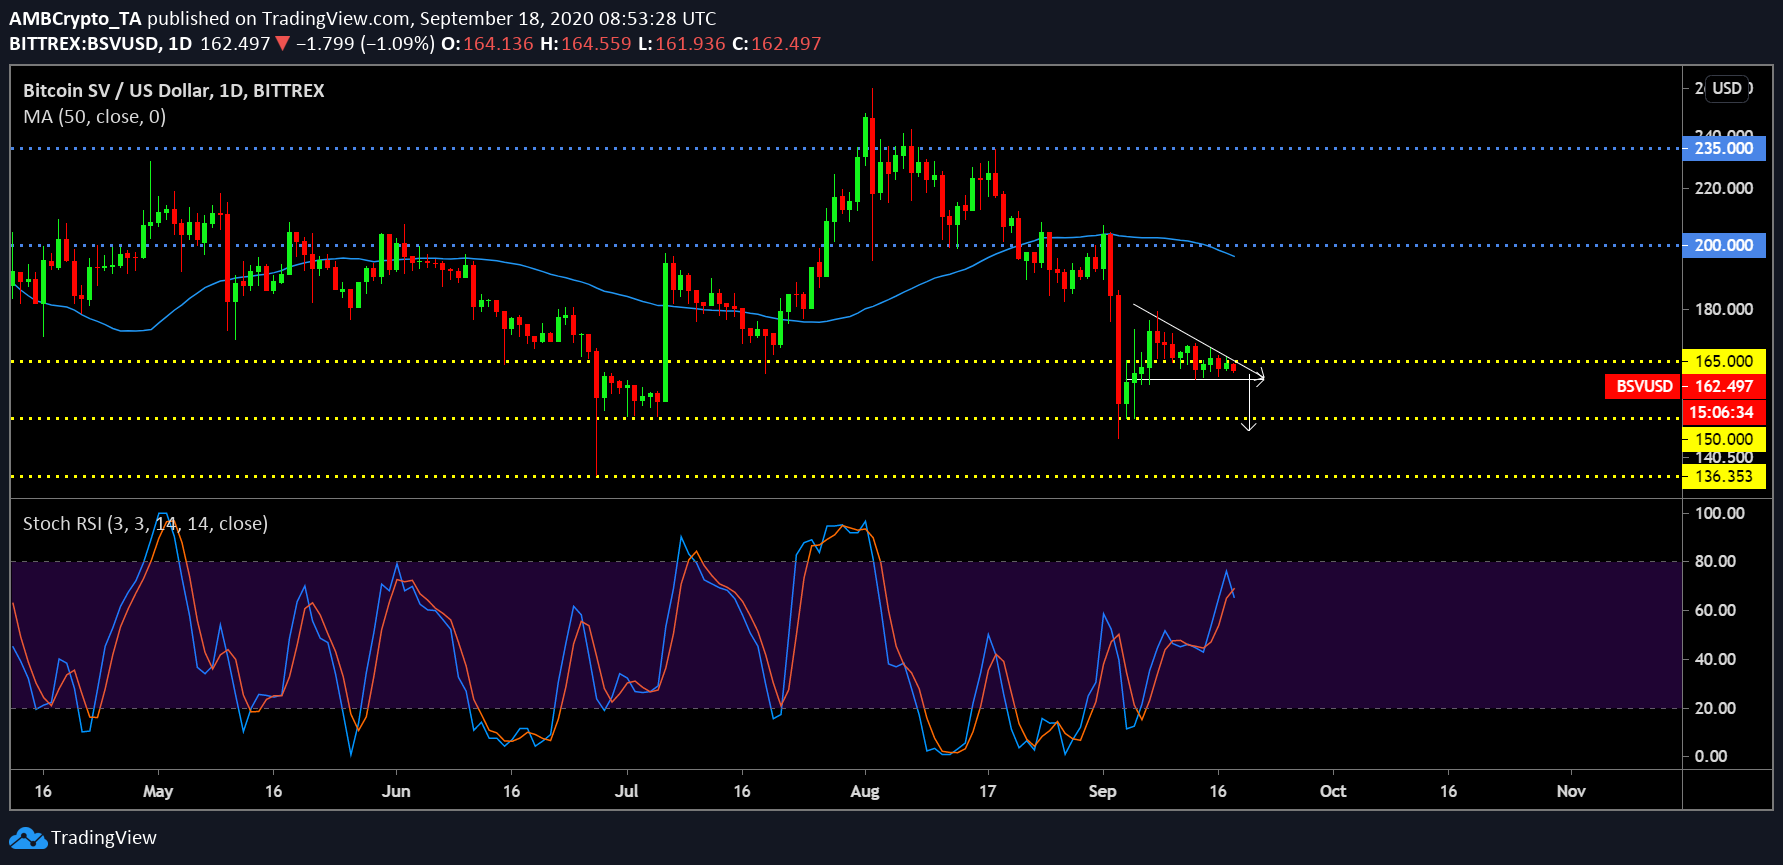
Source: BSV/USD on Trading View
The 1-day chart of BSV clarified the bearish trend to an extent. The stagnancy over the past few days is clear in the charts but now, the formation of a descending triangle seals the deal. Bitcoin SV might not be able to close a position above $165 unless Bitcoin pulls above again but all the signs are hinting towards a drop at the moment. The breakout may as well take place over the next week with the price testing immediate support at $150 once again. Further correction might lead to a drawdown to $136.
The Stochastic RSI also indicated that the bearish pressure is finally coming in terms again. As the signal line exhibited a minor crossover with the RSI line, the trend will radically shift towards a breakdown at any moment.