Analysis
Bitcoin SV long-term Price Analysis: 16 October

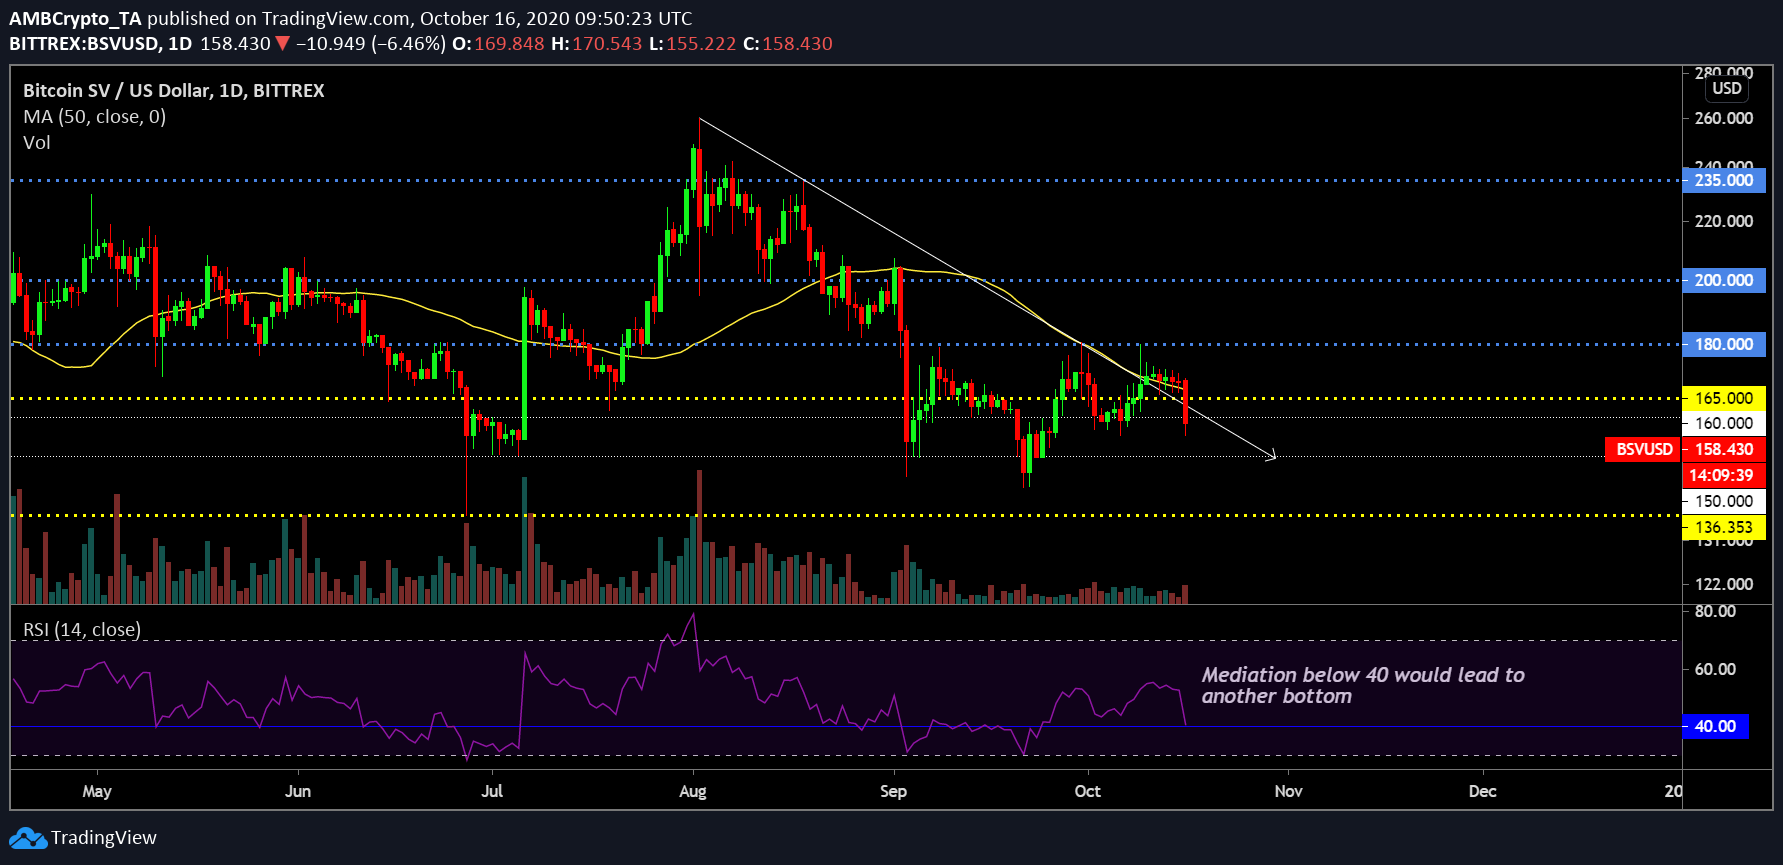
For Bitcoin SV, breaching above $165 has become a formidable task. Since the start of September, the valuation has attained a position above $165, only to face a subsequent drop below the resistance. Over the past few days, a similar trend has followed in spite of its legitimacy to remain above $165.
Bitcoin SV had a market cap of $3 billion at press time while being ranked out of the top-10 crypto assets.
Bitcoin SV 1-day chart

Source: BSV/USD on Trading View
Over the past week, it seemed Bitcoin SV was destined to finally break above its downtrend after consolidating above the 50-Moving Average. However, another sporadic bearish pullback has brought the valuation back below the $165 range. While the price also dropped below the strong downtrend, the Moving Average would be playing as an overhead resistance for the next few days.
From a point of retesting another bottom, the Relative Strength Index or RSI indicated a strong trend. As observed RSI is close to being dragged below 40 as selling pressure increases in the chart. If buying pressure is not able to pull the indicator-up over the next few days, sellers might take the value down to an oversold position, and the price might re-test $150-$155.
With the trading volumes being minimal, the chances of another trend breakout cannot be ignored.
Bitcoin SV 12-hour chart
Source: BSV/USD on Trading View
While the trend incurred bearish sentiment over the next few hours, the 12-hour chart of BSV suggested that crossing long-term resistance at $180 might be a stretched out affair. However, on the bright side, the trend reversal might occur within the next few days. As indicated in the chart, an ascending triangle can be observed, and at the moment BSV is in a position to establish a rally above $165 yet again.
Stochastic RSI indicated that the momentum has been dragged down to an oversold position from where a bullish crossover might unveil. However, the trend was still extremely bearish at the moment, therefore it is important to pay attention over the next week.

