Bitcoin SV long-term Price Analysis: 14 September

Disclaimer: The findings of the following article should not be taken as investment advice as it is the sole opinion of the writer
After the 1st week of September saw the entire market painted in red, the 2nd week presented a window of opportunity for many cryptocurrencies, with most working towards some form of recovery on the charts. While some of these crypto-assets were able to register strong spikes, Bitcoin SV fell well short of an important resistance level. BSV’s decline over the past 24-hours has resulted in further depreciation, leaving the crypto-asset under its critical support level once again.
At the time of writing, Bitcoin SV was valued at $162 with a market cap of $2.98 billion, with the cryptocurrency sliding down to 11th on the rankings.
Bitcoin SV 1-day chart

Source: BSV/USD on TradingView
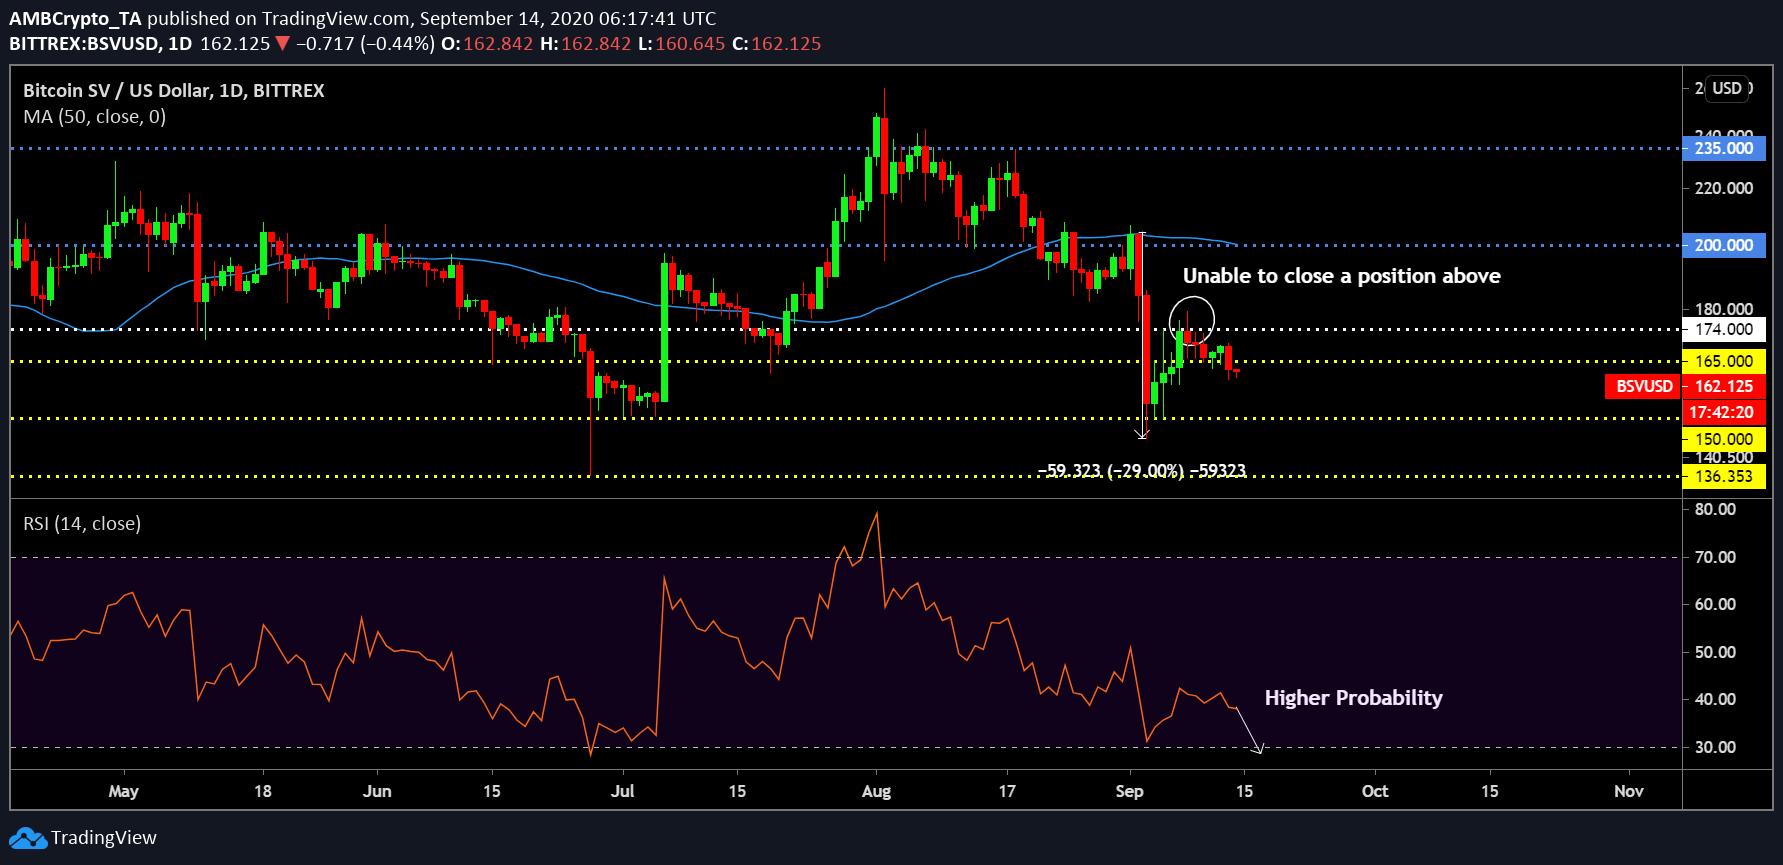
As pointed out in a previous article, Bitcoin SV’s movement upwards after hitting $150 on 2 September was commendable. However, the resistance point at $174 was too much for the crypto-sset to recover. Coincidently, $174 has been an important zone with respect to reversing a bearish trend in the past. Hence, the inability to turn the trend has blown up in Bitcoin SV’s face.
On 8 September, the wick on the bearish candle did move over $174, but the crypto was unable to close its position above $174. While the 50-Moving Average has been acting as a strong overhead resistance, the likelihood of the Relative Strength Index or RSI testing the oversold region was definitely higher, at the time of writing.
At the time, Bitcoin SV was trading well below its previous support line of $165.
Bitcoin SV 1-week chart

Source: BSV/USD on TradingView
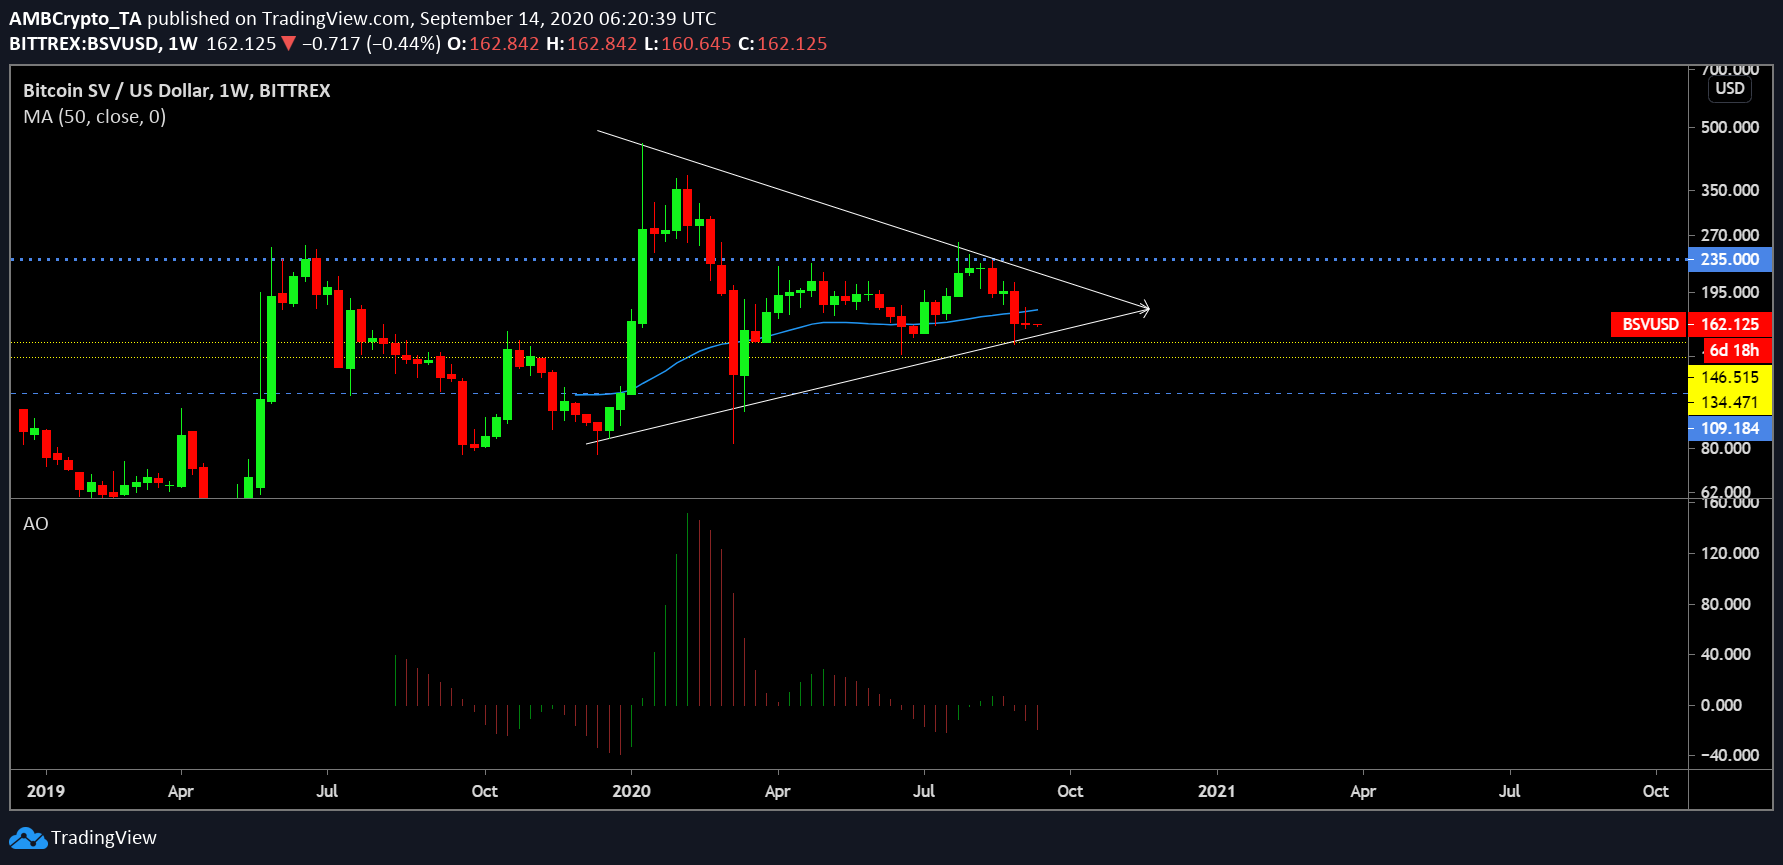
From a weekly standpoint, Bitcoin SV’s movement over the past week was far more evident. While it may seem like an effort on the hourly chart, the intensity of recovery was very limited as the recovery did not even make 10% of the value lost over the 1st week of September.
With the 50-Moving Average strongly asserting pressure from the top, Bitcoin SV is unlikely to undergo another rally, pushing it to overtake $174 in the next couple of weeks. The Awesome Oscillator also highlighted the diminishing bullish momentum and the symmetrical triangle taking shape was possibly undergoing another bearish breakout.
Ergo, Bitcoin SV will possibly test $150 in the next few weeks.


