
Bitcoin SV, at the time of writing, was facing a major dilemma within the price range of $165-$180. With BSV’s price oscillating between $160 and $180, the crypto-asset was not found to have taken advantage of Bitcoin’s northbound rally. However, while Bitcoin may be on a high right now, many expect the king coin to undergo corrections soon on the charts.
For its part, Bitcoin SV might follow BTC’s lead too, especially since its own bearish implications can be drawn out from the following analysis.
Bitcoin SV 1-day chart
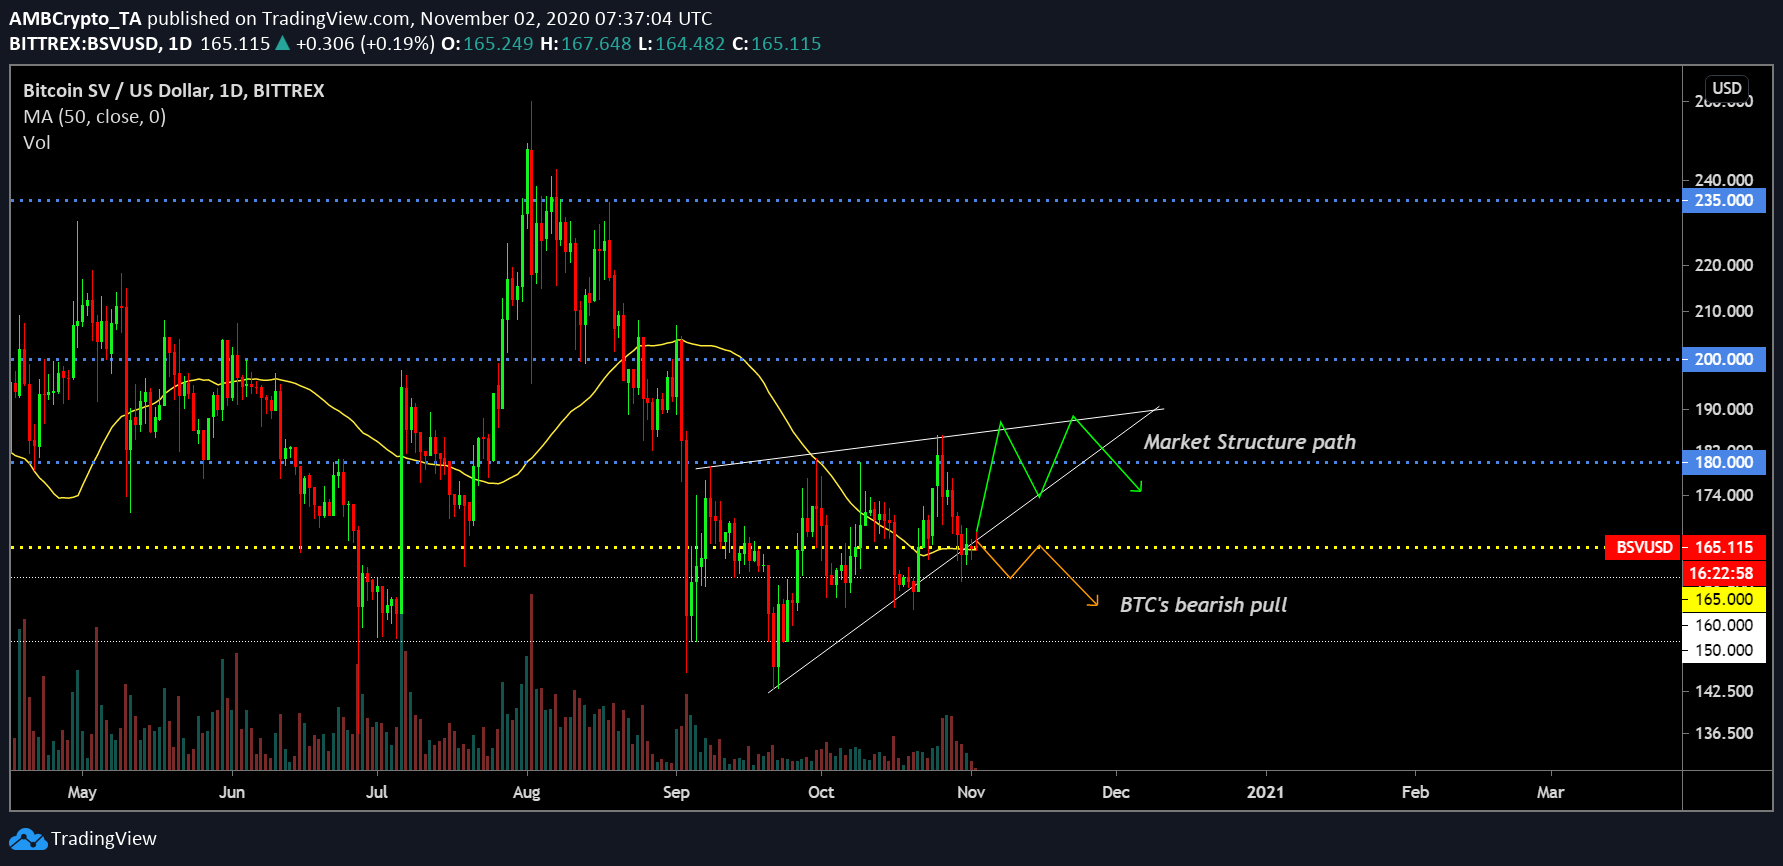
Source: BSV/USD on Trading View
The long-term bearish pattern was clear for BSV as its 1-day chart noted a rising wedge pattern. While the breakout seemed imminent, it might not be time just yet. Picturing consolidation near the lower ascending trend line, BSV might note another rally above the $170-$180 range. While the price will undergo a bearish correction sooner or later, its movement at the time of writing was a little uncertain.
A flash correction for Bitcoin might lead to a direct decline for BSV and a re-test of the supports at $160 and $150 will be a possibility. On the contrary, a normal market structure would allow northbound movement on the charts.
Reasoning
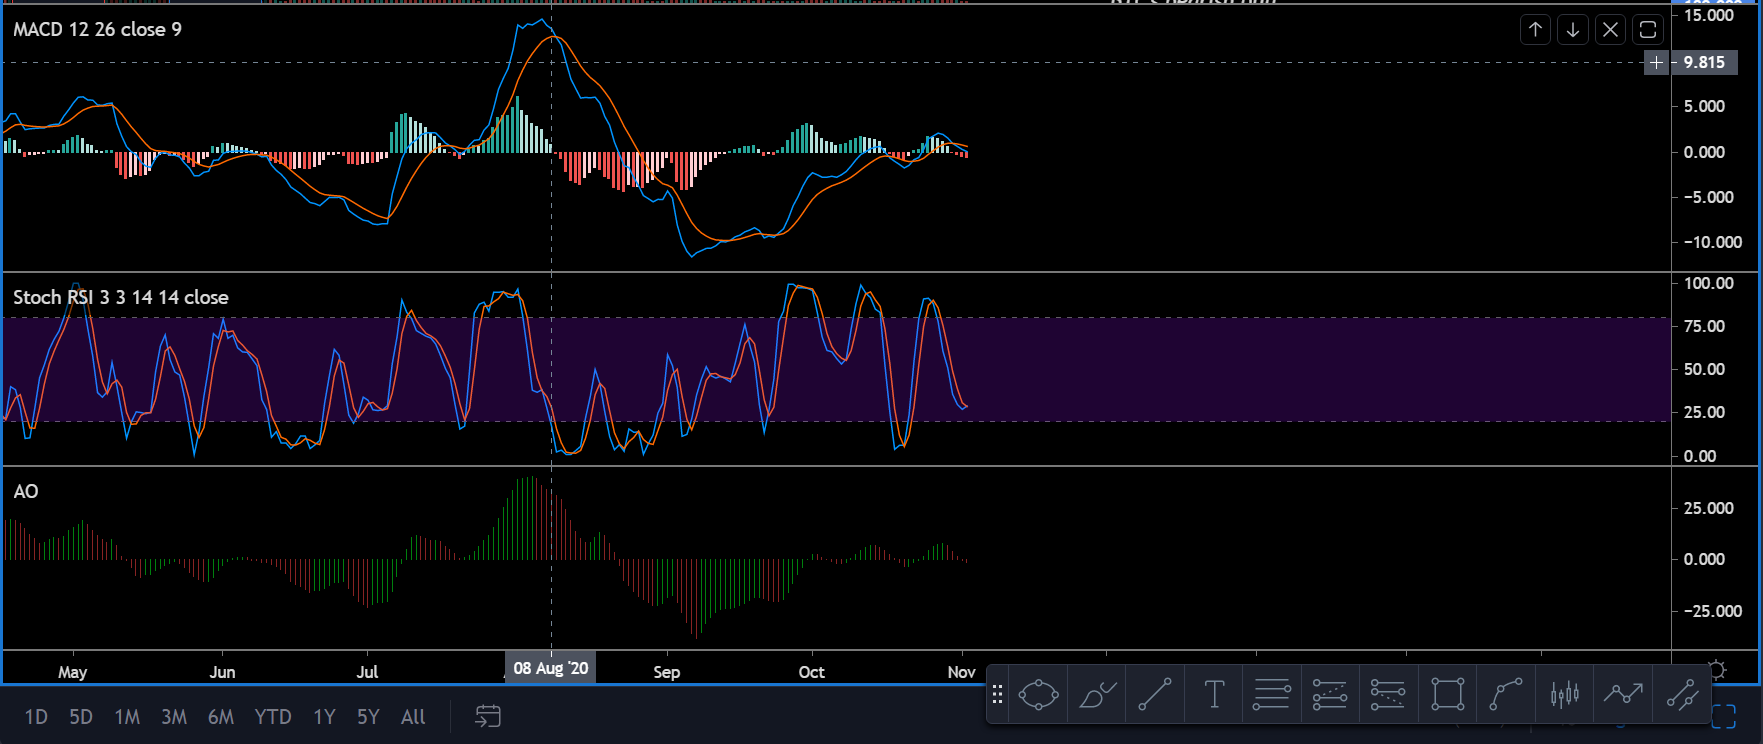
Source: BSV/USD on TradingView
A majority of the market indicators pointed to a bearish rally from hereon, but the Stochastic RSI was intending to complete a bullish crossover near the oversold region. This particular indicator was not supported by the MACD as a clear bearish trend was evident with the MACD and the Signal line.
Similarly, the Awesome Oscillator failed to indicate any brewing bullish momentum for BSV as the market strongly relied on Bitcoin for a response. However, that might not be the entire case.
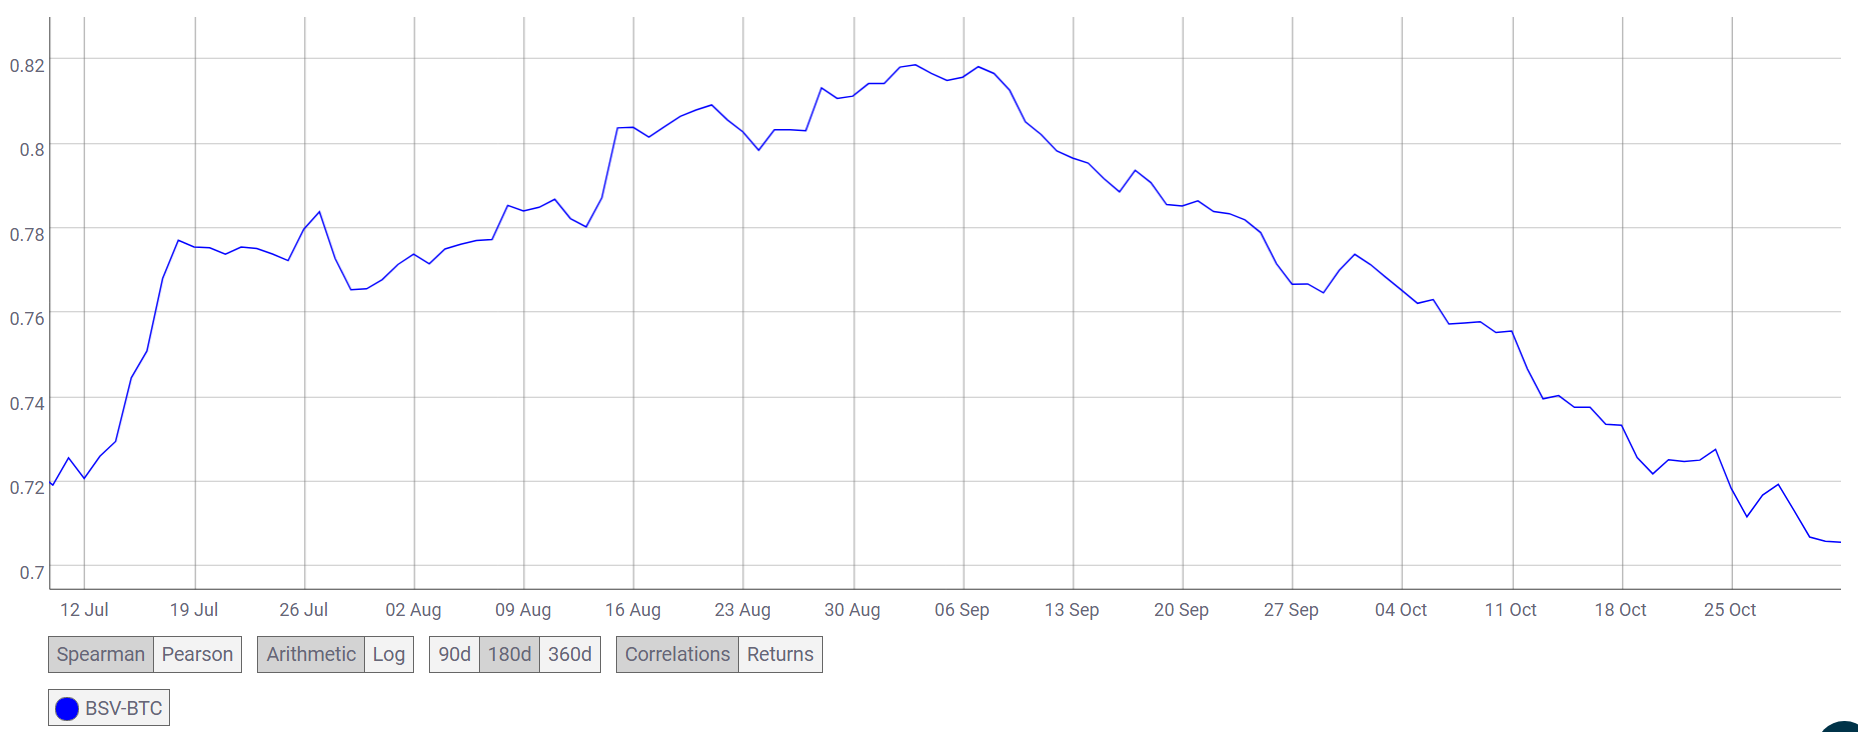
Source: Coinmetrics
Bitcoin SV and Bitcoin have been noting a dramatic decline in correlation since the start of September and it might factor in during the bearish correction as well. While Bitcoin may drop on the charts at corrections set in, BSV might not decline below its strong support at $150.
Conclusion
The long-term trend for Bitcoin SV seemed to suggest sideways movement between $165-$180, at press time, as the collective market awaited another bullish or bearish rally.