Bitcoin: Should BTC traders brace for more downside in January as…

- Bitcoin analysis on CryptoQuant showed a prevalence of selling pressure in the last few weeks, which could carry over into January.
- Evaluating the possibility of a bounce back from BTC’s 50-day Moving Average.
It’s a wrap for 2024 and traders are curious about Bitcoin’s [BTC] price action in 2025. The overall consensus has been mostly bullish for the next twelve months, but the market outcome has been bearish as 2024 comes to a close.
The bearish price action is the result of intensified sell pressure as observed recently. A fresh CryptoQuant analysis revealed that the Binance 30-day Taker Buy-Sell Ratio has been flashing signs of more seller activity.
The analysis highlighted the significance of the observations on Binance, noting that the exchange’s large trading volumes can influence market sentiment. Additionally, the monthly Taker Buy/Sell ratio confirmed a strong pivot from November’s bullish activity.
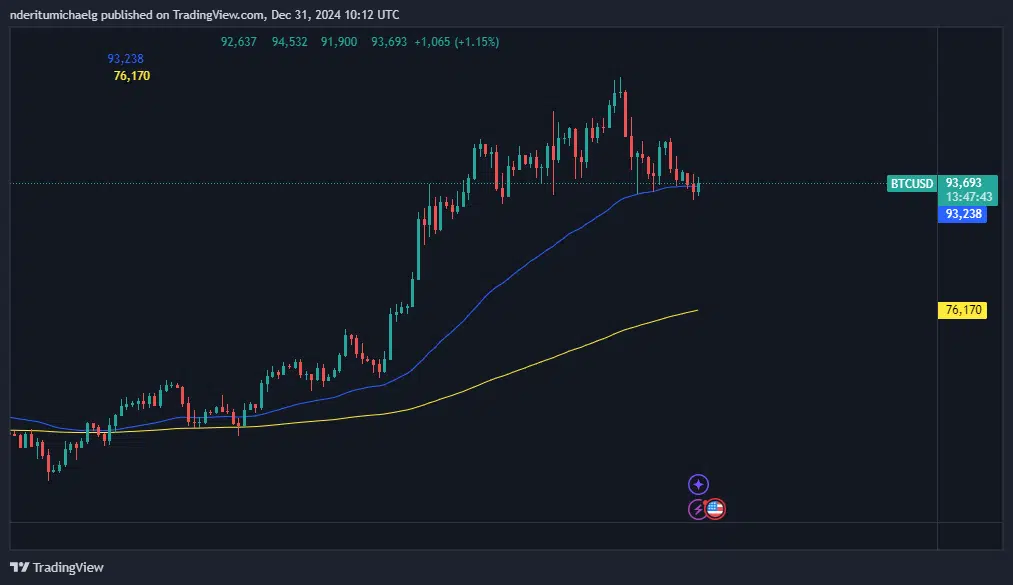
This analysis reflects Bitcoin’s recent bearish bias, particularly in the last two weeks of December. It has dropped by 13.48% from its all-time high earlier in the month to its current price of $93,856 at press time.
It is worth noting that BTC’s recent price action has pushed into the 50-day Moving Average (MA). Additionally, it has been consolidating around the same price range.
This consolidation around the 50-day MA could potentially pave the way for a bullish pivot. Conversely, a dip below the MA could trigger an acceleration of selling pressure.
Can Bitcoin drum up enough demand for the 50-day MA?
Bitcoin flows were notably lower in the second half of December compared to the first half. This was particularly evident with spot flows, especially outflows, as the price approached the 50-day MA.
Despite this, net flows remained negative, indicating a lack of confidence in the market.
The decline in spot flows is reflected in large holder flows. Inflows into large addresses were notably higher than outflows during the weekend. This was confirmation that whales gained some confidence as sell pressure diminished, hence the slight accumulation.
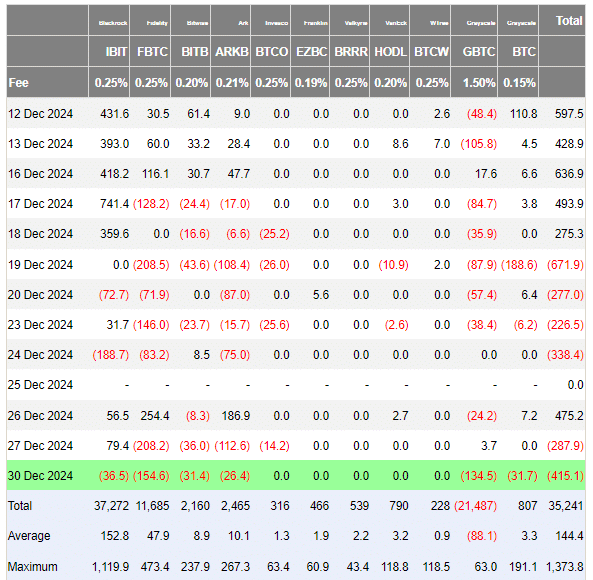
On the other hand, net flows into large addresses remained low, indicating a cautious approach and lack of directional confidence. Meanwhile, spot ETF flows were off to a negative start this week.
Bitcoin spot ETFs contributed approximately $414.1 million worth of selling pressure on Tuesday, a notable increase from the $287.9 million outflows observed on the 30th of December.
These flows suggest that the bearish momentum could continue into the first week of January, potentially triggering more outflows as the price dips below the 50-day MA.
Read Bitcoin [BTC] Price Prediction 2025-2026
Investors should monitor mid-week performance closely, as a mid-week bullish bounce could potentially set the pace for January.


