Analysis
Bitcoin set for market correction, but Fibonacci retracement lines give buyers upper hand

Bitcoin managed to see some bullish momentum on 9 October, taking its prices over the $8,000 mark after a continuous struggle to remain above the $8k mark since 24 September’s massive fall. At press time, Bitcoin was trading at $8,518 with a gain of 3.74% on the 24-hour price chart on CoinMarketCap.
1-Hour Price Chart

Source: BTC/USD on TradingView
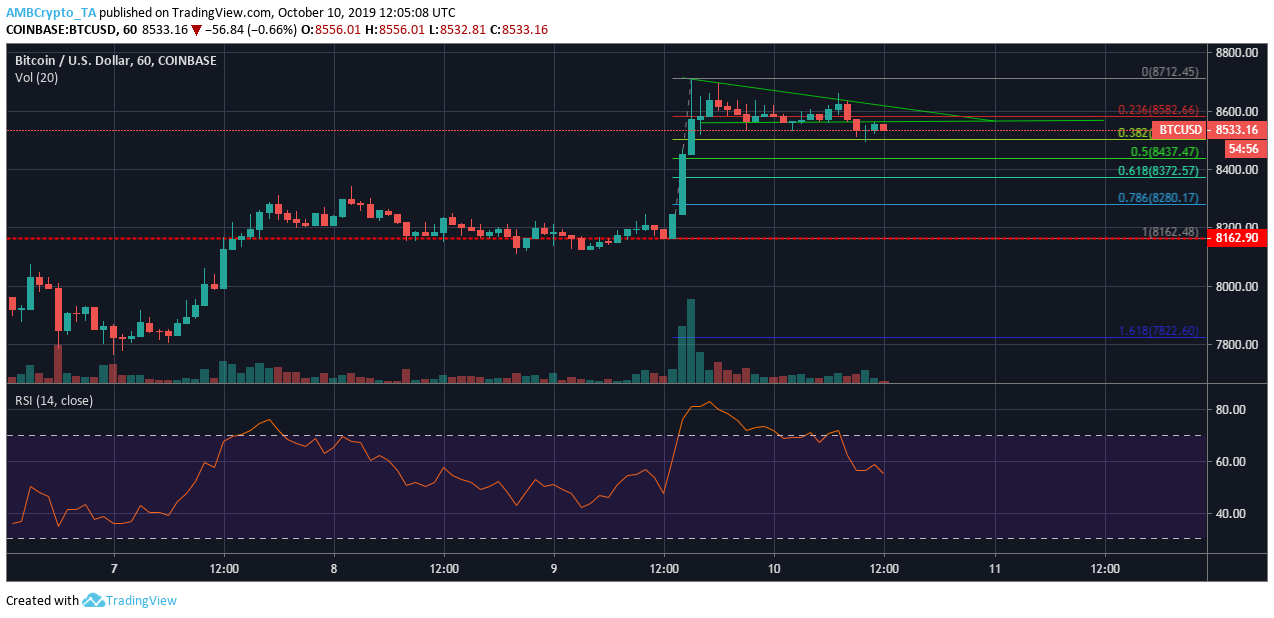
On the one-hour price chart, Bitcoin formed a descending triangle characterized by lower highs and touching the descending line at $8707, $8694, and $8631, while it also had a constant baseline forming at $8563. A descending triangle formation is followed by a bearish breakout, which means the market might be entering a correction phase and the price breakout, even though bearish, won’t be a drastic fall.
Looking at the Fibonacci Retracement lines, the downfall might not be below the support of $8,262. The RSI indicator confirmed the same as it suggested that the buyers still had an upper hand in the short-term market.
4-Hour Price Chart
Source: BTC/USD on TradingView
The 4-hour price chart saw the formation of an ascending channel characterized by higher highs meeting at $8,108, $8,656, and $8,670, while the higher lows met the ascending channel at $7,809, $8,101, and $8,165. An ascending channel is often followed by a bearish breakout, which in this case, might be minimal and could be a market correction.
The MACD line remained above the signal line and might see a bearish crossover in the near future, suggesting a bullish market in the short-term.
Conclusion
Bitcoin just saw a boom in its prices on 9 October, but within a day, it suggested the formation of two bearish patterns on the 1-hour and 4-hour price charts. Despite being bearish, the fall of BTC might just be an attempt to correct its price. MACD and RSI indicator suggested that the buyers had an upper hand in the short-term market, and the Fibonacci retracement lines indicated that the market correction might not bring the prices below $8k mark.
