Bitcoin ‘seller pressure’ drags Coinbase premium index to 12-month low – What’s next?

- Coinbase Premium Index dropped to levels last seen in 2022.
- BTC climbed above $96.8K and could set its eyes on $99K.
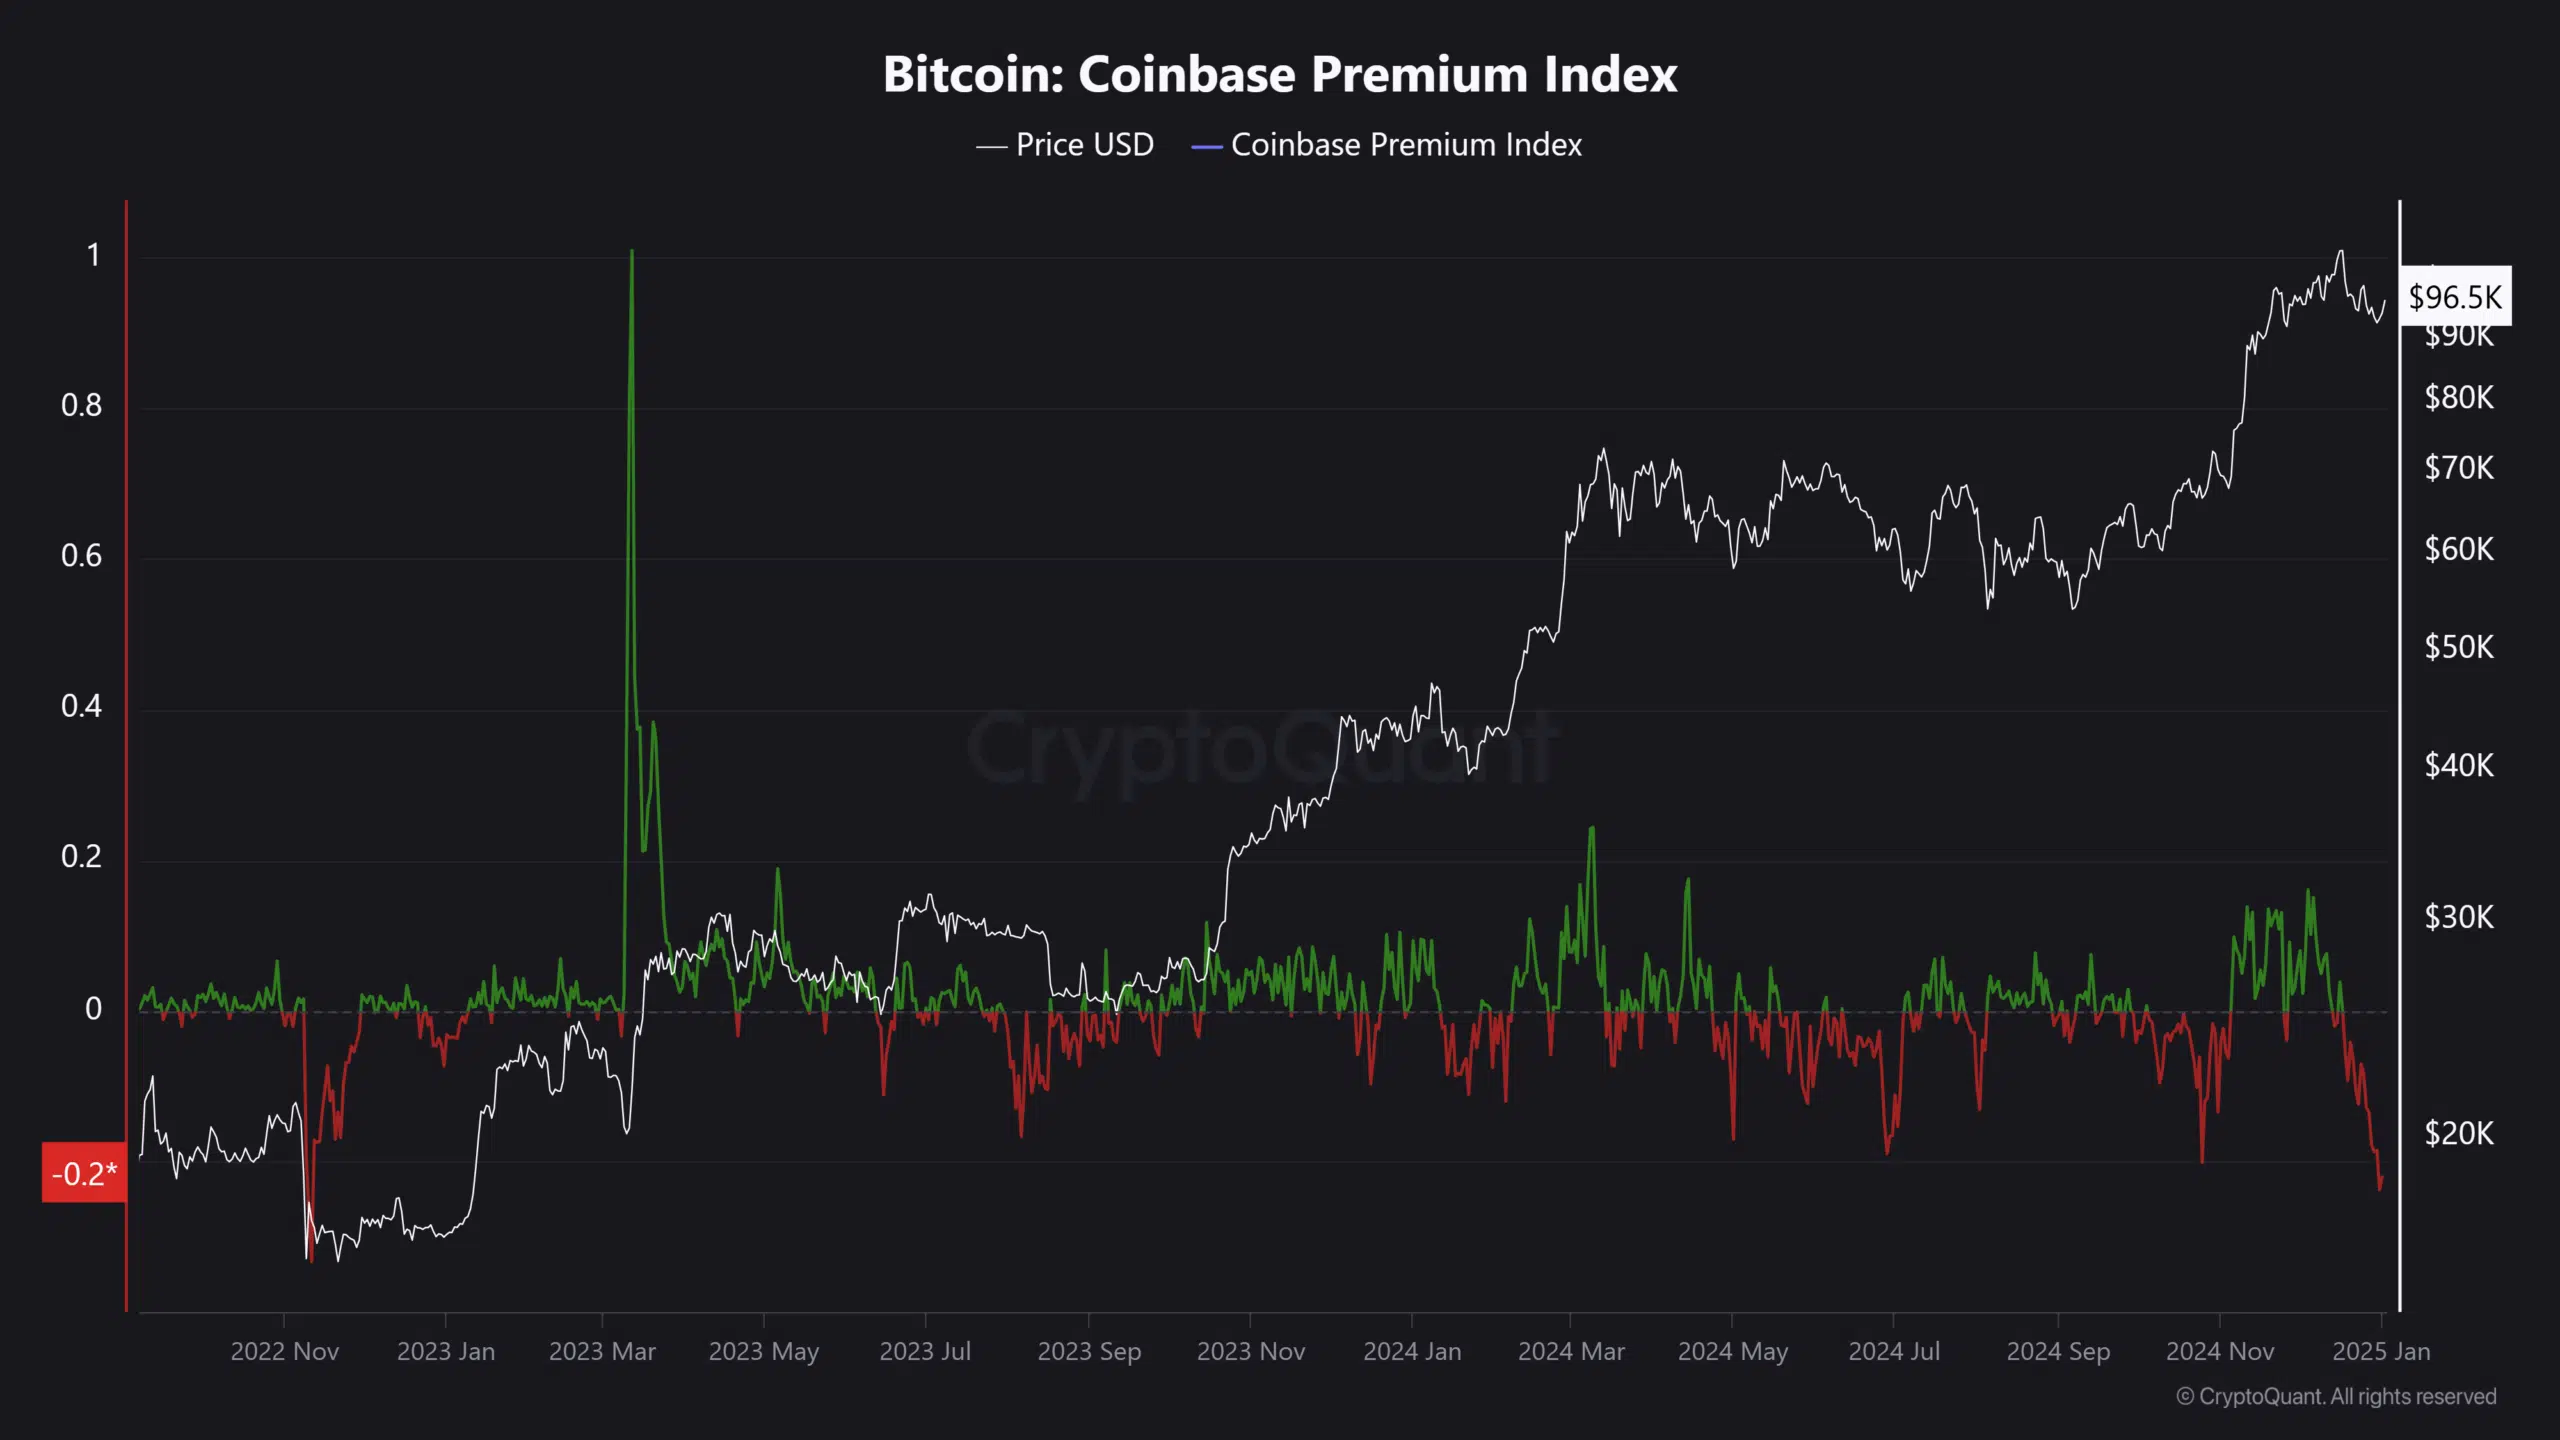
The U.S. investors’ appetite for Bitcoin [BTC], as measured by the Coinbase Premium Index, has dropped to levels seen during the 2022 crypto winter.
Since mid-December, after BTC topped $108K, selling pressure intensified into the holiday season, dragging BTC to as low as $92K.
The December sell-off saw the index decline to -0.2, a reading last seen during the FTX implosion in 2022.
BTC sell-off
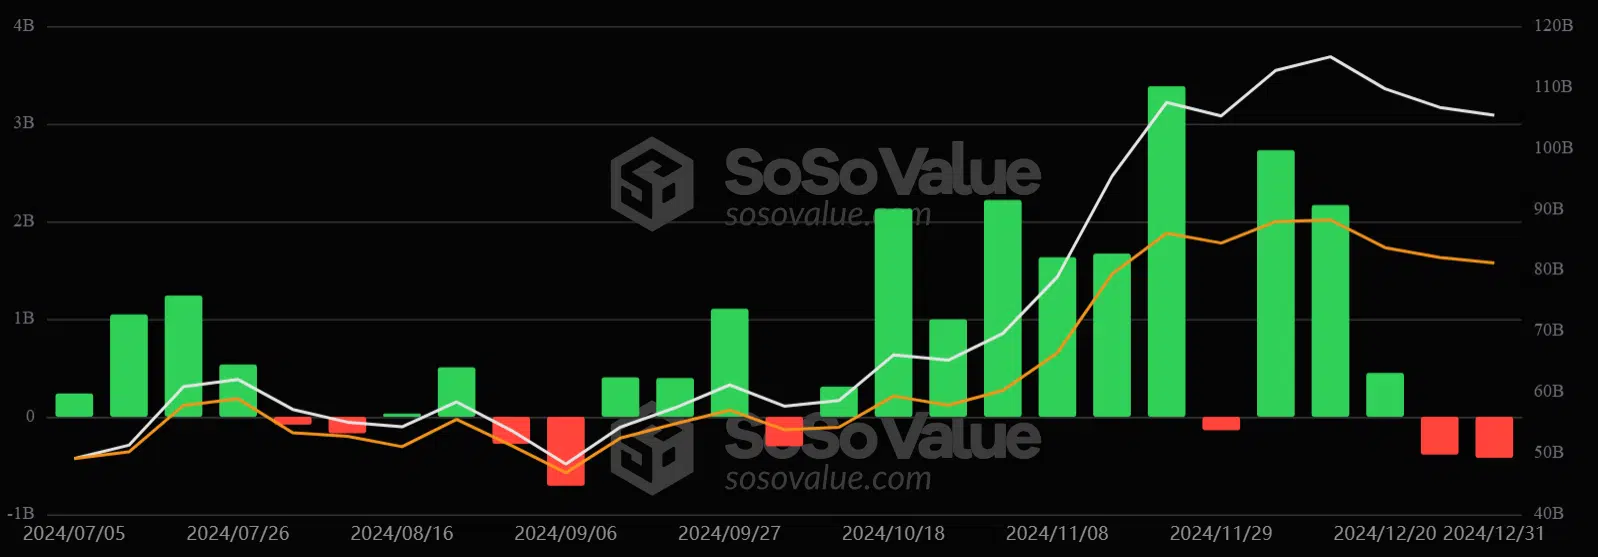
The ensuing profit-taking was also seen across U.S. spot BTC ETF products. Over the past two weeks, the ETFs saw net outflows.
Interestingly, the overall sell-off in the Coinbase exchange also began in mid-December, suggesting a risk-off investor approach into the holiday season.
However, Joao Wedson of analytics firm Alphractal claimed that the dump was coming from long-term holders (LTH). LTHs are users who’ve held BTC for 155 days or more.
So, what’s next for BTC with subdued sentiment amongst U.S. investors?
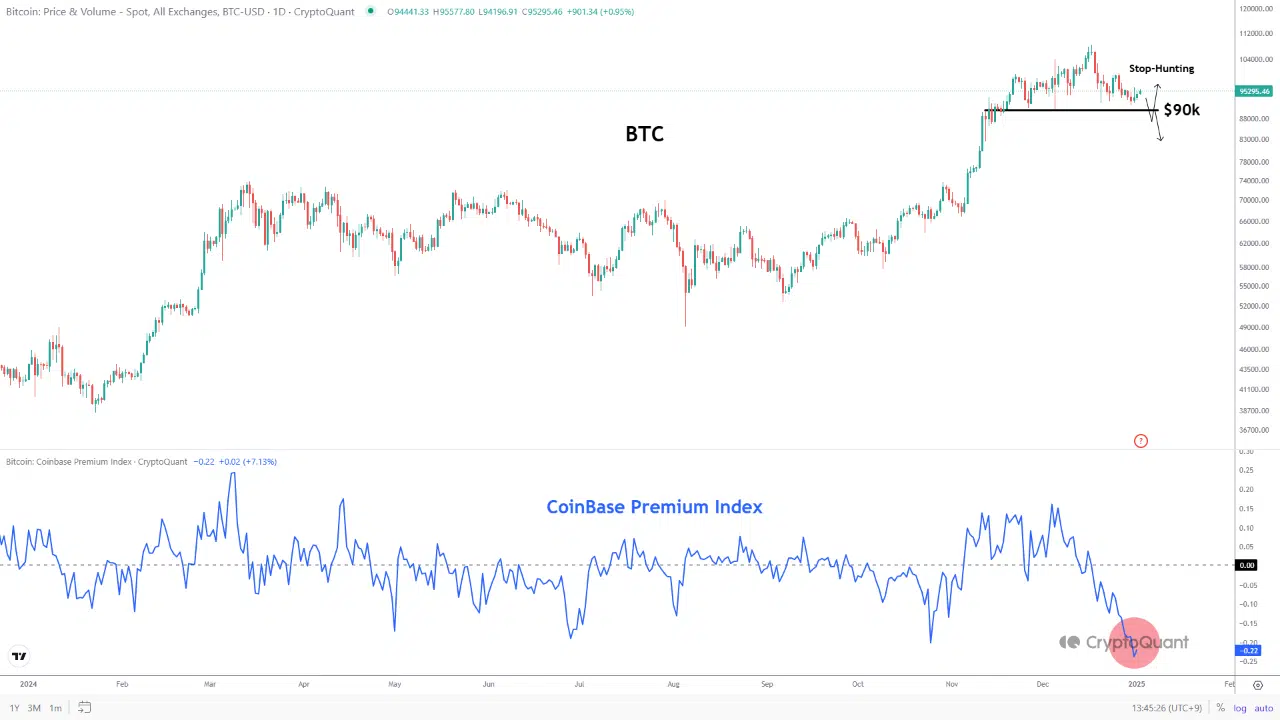
According to pseudonymous CryptoQuant analyst, MAC D, the low Coinbase Premium Index reading suggested a potential rebound, especially if BTC holds above $90K. He said,
“In past bullish phases, when the premium turned negative, it often led to a rebound and continued upward trend. This suggests that when U.S. investors’ sentiment was at its most pessimistic, major buying pressure entered the market, driving prices up.”
Interestingly, overall exchange deposits have declined to 2016 levels. This signaled a dominant holding strategy amongst investors, a trend that underscored the asset’s long-term positive outlook.
Now that the holiday season is over, will the US demand for BTC surge again? Inflows into BTC ETFs in early January will offer more clues about whether the short-term muted sentiment will persist.
Read Bitcoin [BTC] Price Prediction 2025-2026
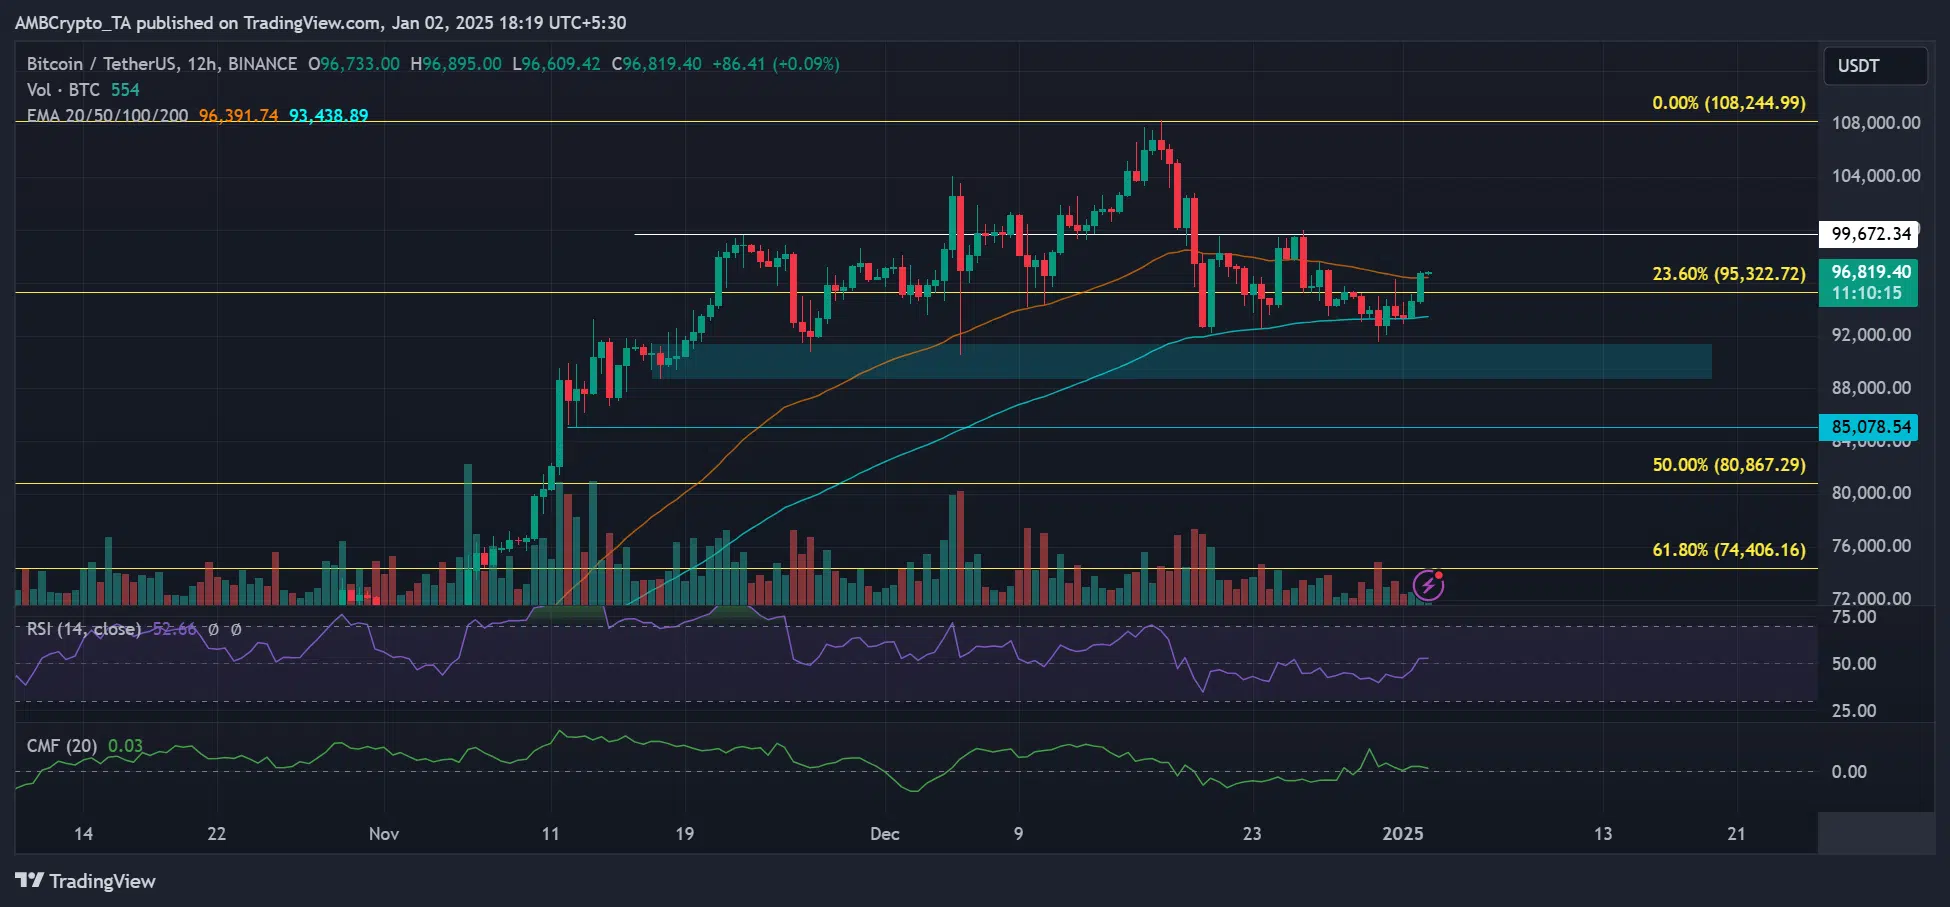
In the meantime, the asset looked set to reverse its December sell-off after tapping $96.8K and climbing the 50-day EMA on a 12-hour chart.
An extended rally could make $99K and $100K reachable. However, capital inflows were still flat, as illustrated by the CMF (Chaikin Money Flow) indicator.


