
Key Takeaways
Bitcoin saw 3,000 coins moved from a 5-year dormant whale right after the ATH, and it’s turning heads. Are the OGs quietly setting up exit liquidity, or is the market reading too much into it?
Bitcoin [BTC] is in day three of sideways action after hitting $123k, leaving the market in a bit of an indecision zone. Is this a top forming, or just a short cooldown before the next parabolic leg?
On chain, spikes in Coin Years Destroyed (CYD) usually show long-term holders taking profits, often around market peaks. Notably, Lookonchain flagged an OG wallet moving 3,000 BTC after five years of dormancy.
Backing this, BTC’s CYD has jumped nearly 570 million in just two months. For context, the previous all-time high at $111k in May coincided with a CYD peak at 5.20 billion, which sparked a 9% pullback in just three weeks.
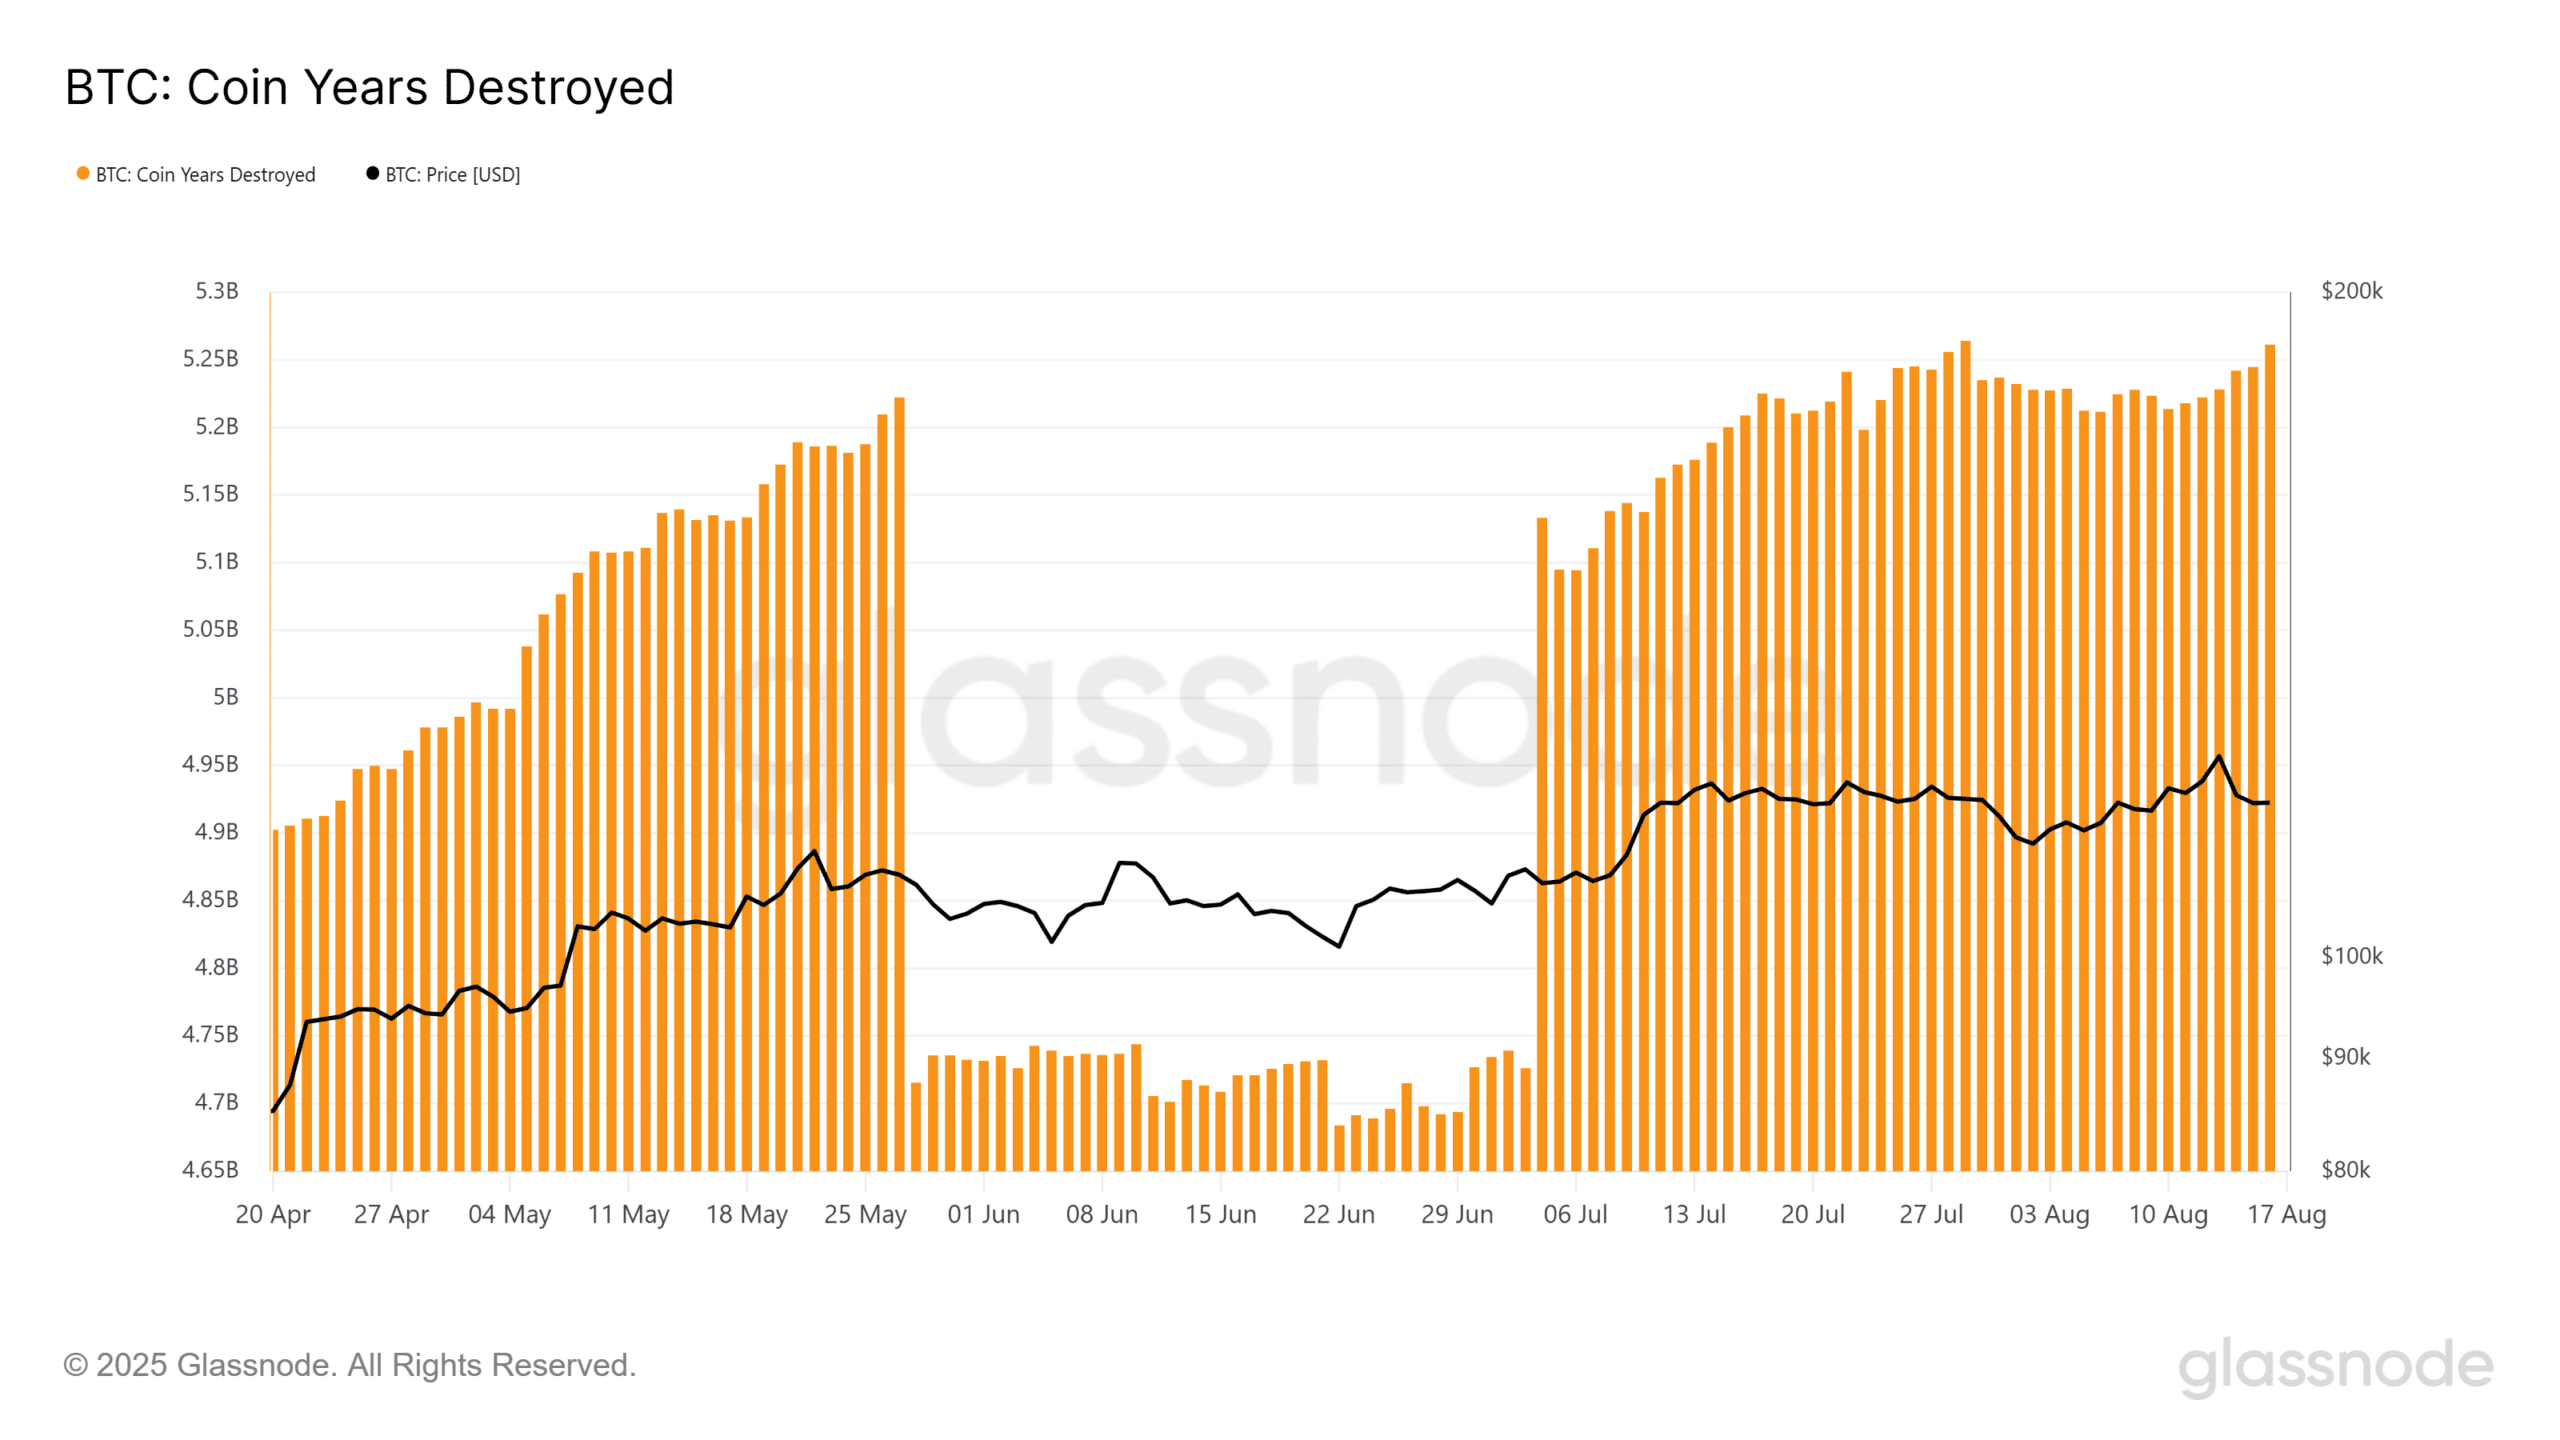
Source: Glassnode
Fast-forward to now, Bitcoin’s CYD is sitting at 5.26 billion, taking out the May high.
That tells us the OG whale move isn’t just a fluke. Instead, if history’s any guide, this kind of reactivation usually lines up with a distribution phase, hinting the market might be topping.
In that light, BTC’s 4.8% pullback off the $123k all-time high could just be the kickoff. If the trend sticks, a dip down to test $110k as support looks totally plausible, unless bid-side liquidity steps in.
Bitcoin spot and derivative volume snapshot
Market sentiment is hovering around neutral, well below euphoria-driven tops and above panic-induced capitulation zones. Overall, the market is in a phase of indecision.
Positioning metrics are critical here. Historically, near local tops, derivative volume dominates spot volume, exceeding a 10:1 ratio. In such regimes, even modest spot-side pressure can trigger cascading liquidations.
As the chart shows, volume spikes often coincide with tops, triggering panic-driven moves. On the 14th of August, derivatives hit 500k+ BTC vs. 46k BTC on spot, sparking a 3.45% pullback off $123k all-time high.
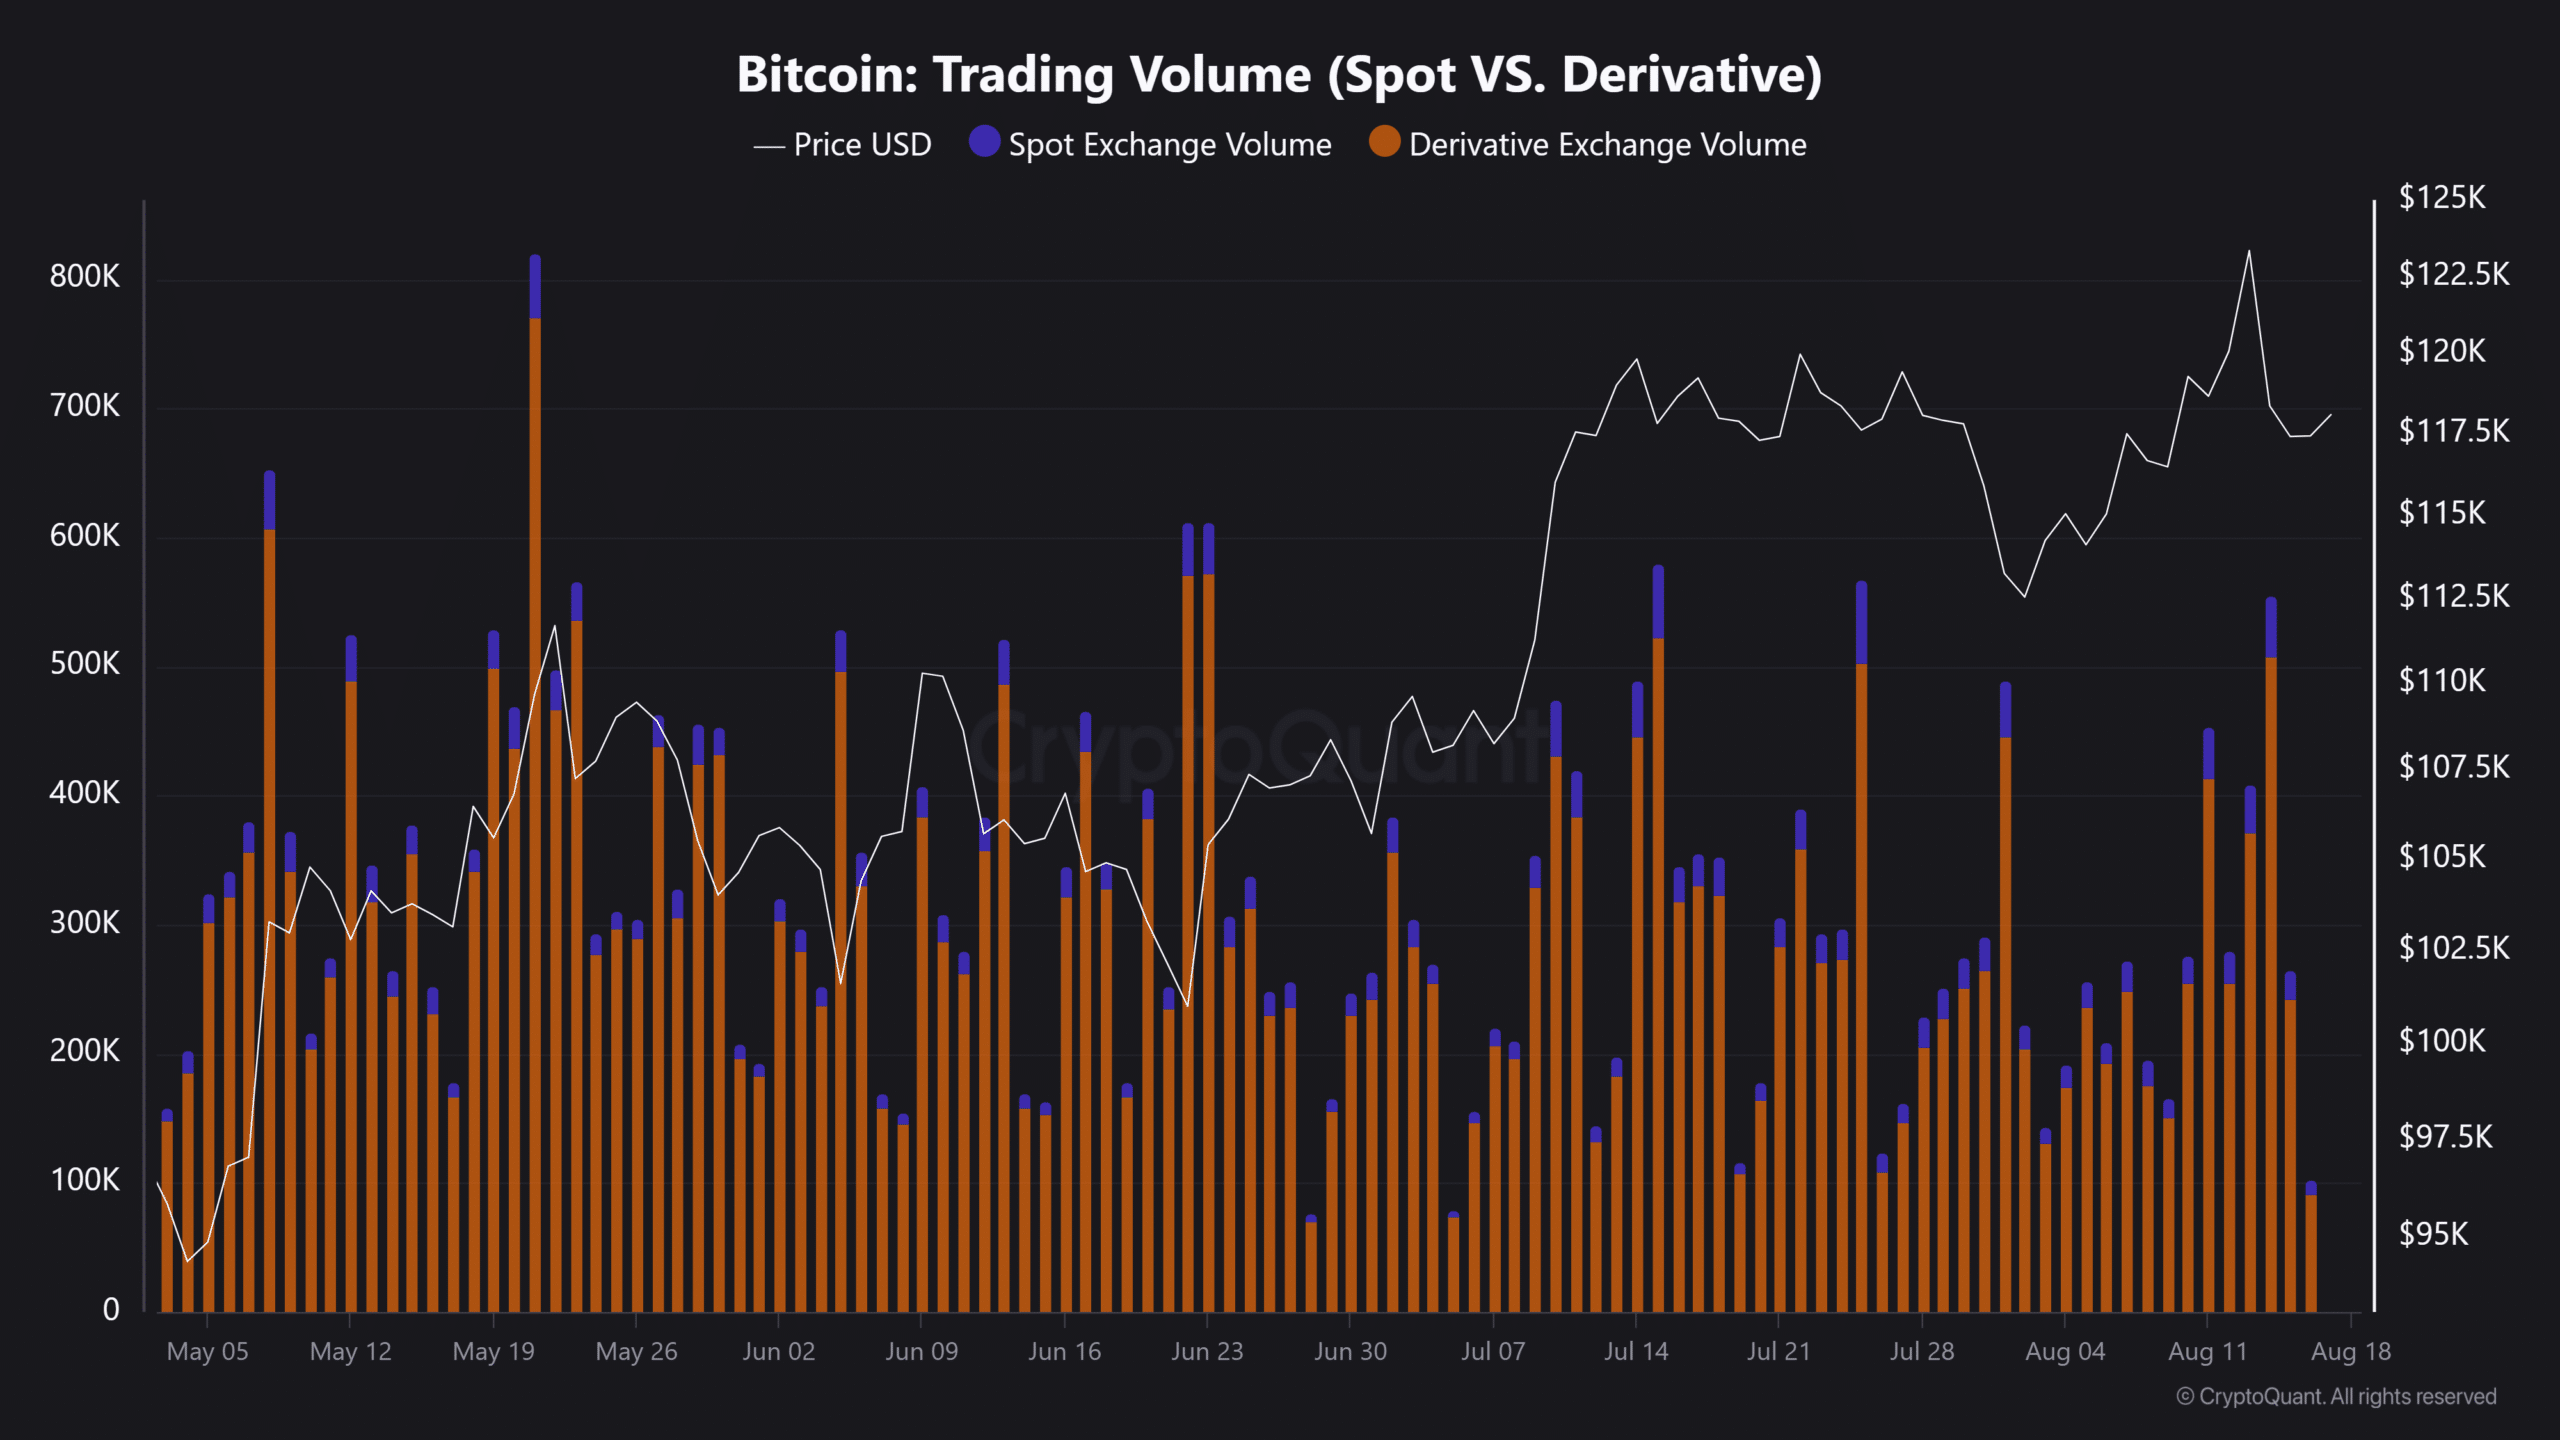
Source: CryptoQuant
Historically, when positioning like this stacks up, it often traps Bitcoin in a volatility loop, with traders over-leveraging in a weak spot market, fueling back-to-back long squeezes.
At press time, the derivatives-to-spot ratio has pulled back below 10, signaling that leverage stress has eased for the moment. Still, 70%+ of the market is skewed long.
With Bitcoin’s CYD echoing historical top patterns, a fresh spike in derivatives positioning could confirm a potential top. Until then, BTC looks relatively safe from a volatility loop, keeping a top scenario at bay.


![Real-world assets [RWA]: How to invest in Gold & Real Estate on-chain](https://eng.ambcrypto.com/wp-content/uploads/2026/02/Samyukhtha-5-400x240.webp)