
The Crypto Fear and Greed Index stood at 56 as Bitcoin held onto the $11,300 price level. The narrative of “Bitcoin is a hedge against inflation” was just one of many reasons that giants in the financial services sector or other investors acquired Bitcoin. Bitcoin serving no “singular” purpose, but multiple ones were bullish for the coin in the long term. On the charts, Bitcoin was moving sideways once more while Monero was in a corrective phase. Dogecoin clung to a level of support in the face of selling pressure.
Bitcoin [BTC]
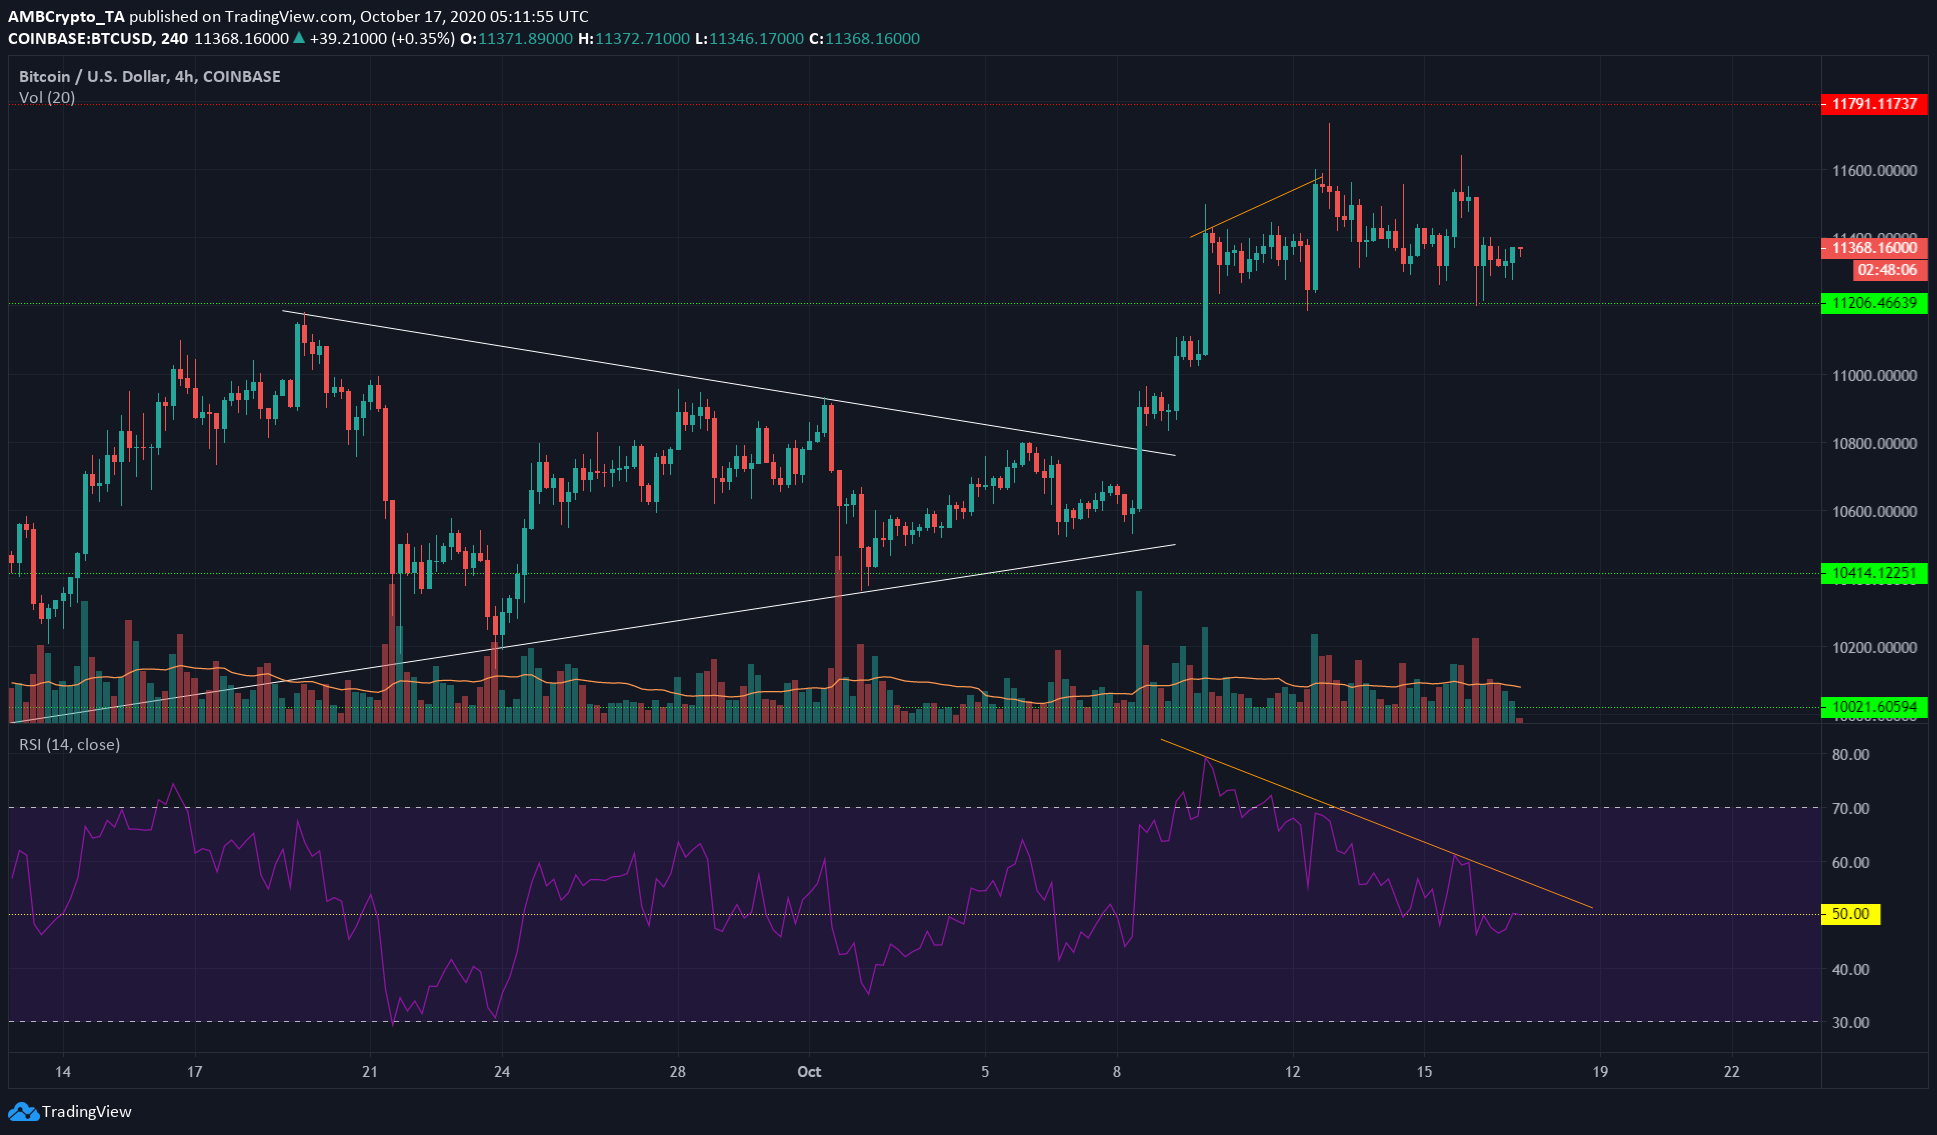
Source: BTC/USD on TradingView
Bitcoin had formed a symmetrical triangle (white) and broken out of the pattern to the upside. But a bearish divergence was spotted as Bitcoin attempted to head north of $11,600.
Shown in orange, the price made higher highs as the momentum indicator (RSI) made lower highs. This showed that the bullish momentum had lost steam and BTC would be forced to drop.
Bitcoin was forced as low as $11,200 before recovery. The $11,300 and $10,800 are important levels of support for the asset. A break above $11,600 would mean bulls were strong in the market.
Another thing to keep an eye on would be if RSI broke upwards past the descending trendline (orange). This could accompany a BTC move upward.
Monero [XMR]
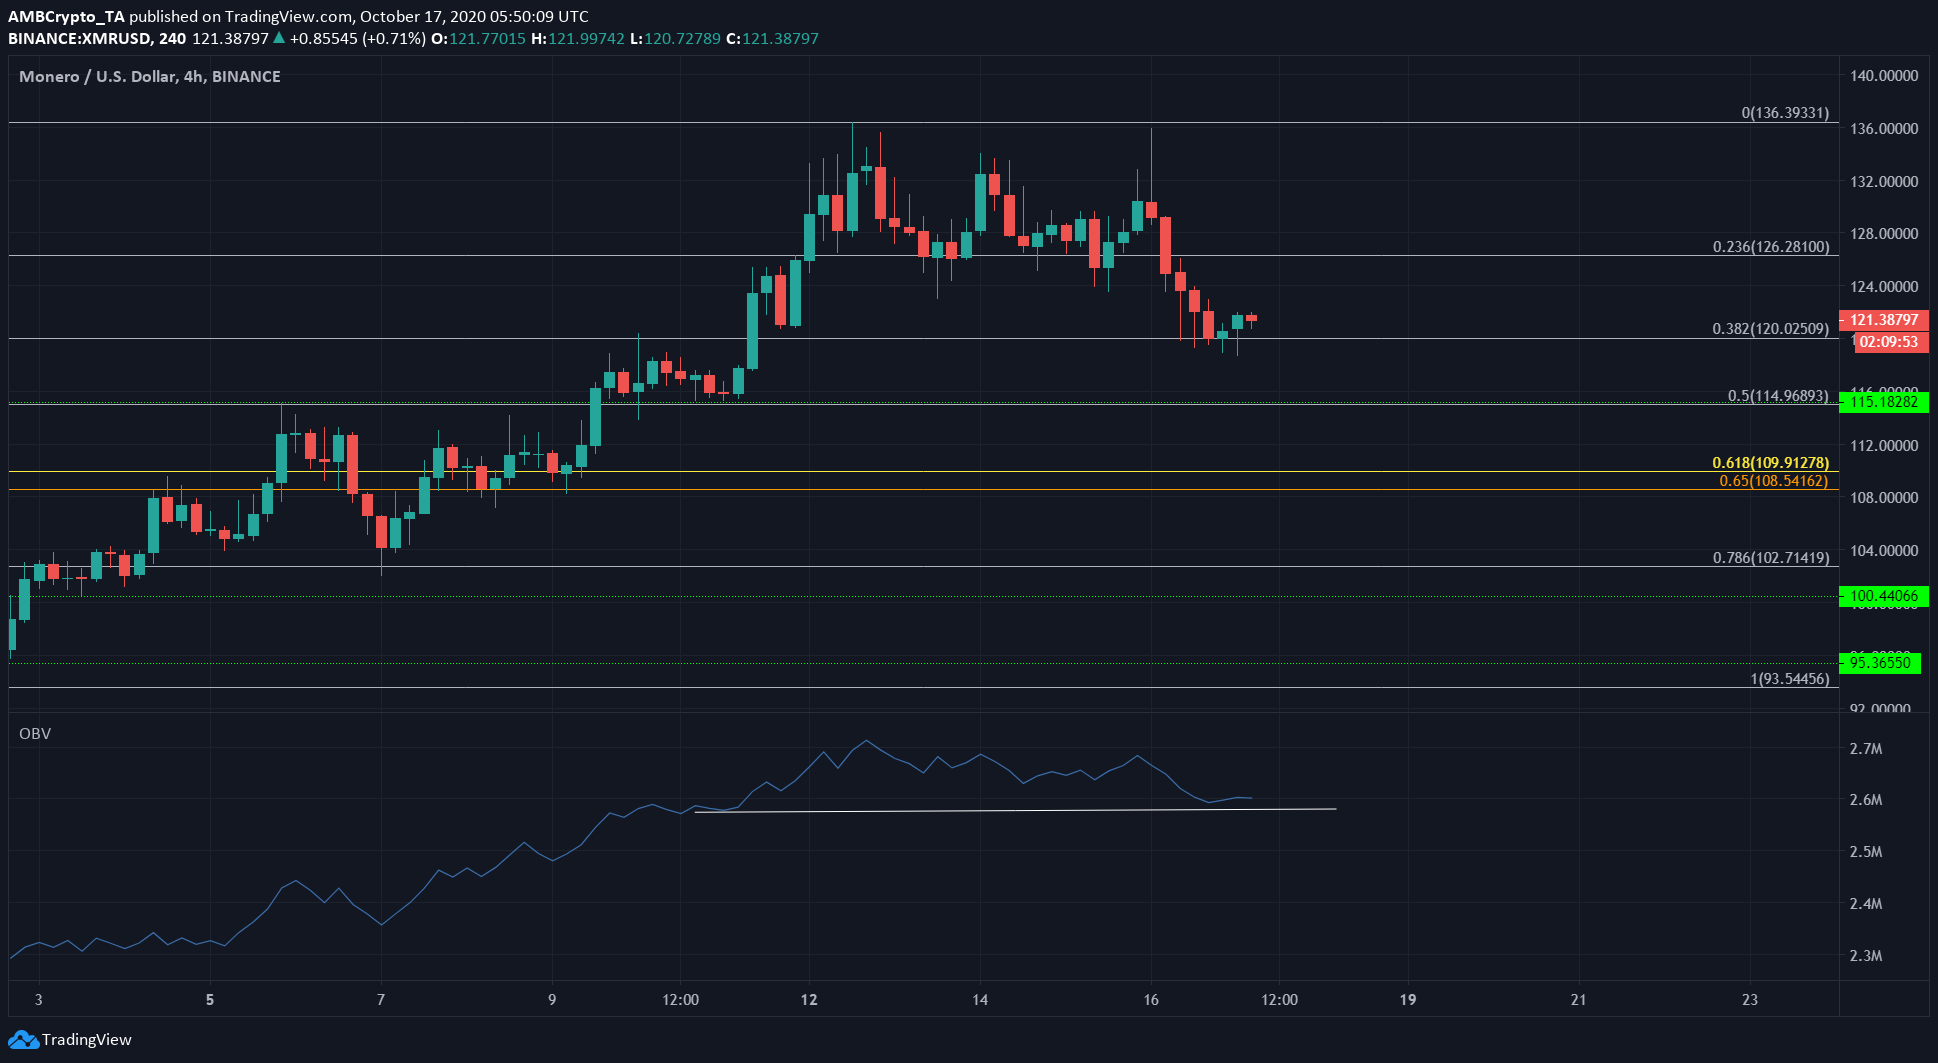
Source: XMR/USD on TradingView
The uptrend for XMR was still in play. As shown by the Fibonacci Retracement tool, the asset was pulling back to key retracement levels before another move upward. This move could take days or even a couple of weeks to break above $135.
It can be seen that the 38.2% retracement level held well as support. The 50% retracement also coincides with the $115 historic level, reinforcing its strength.
The OBV showed that buying volume was still strong. The white line on the OBV is a level to watch out for. If OBV moved beneath this line, it would indicate that buyers were losing their grip on the market. It could presage a move for XMR beneath $115 support.
In other news, XMR market cap at $2.1 billion was a two-year high, after September 2018’s $2.25 billion.
Dogecoin [DOGE]
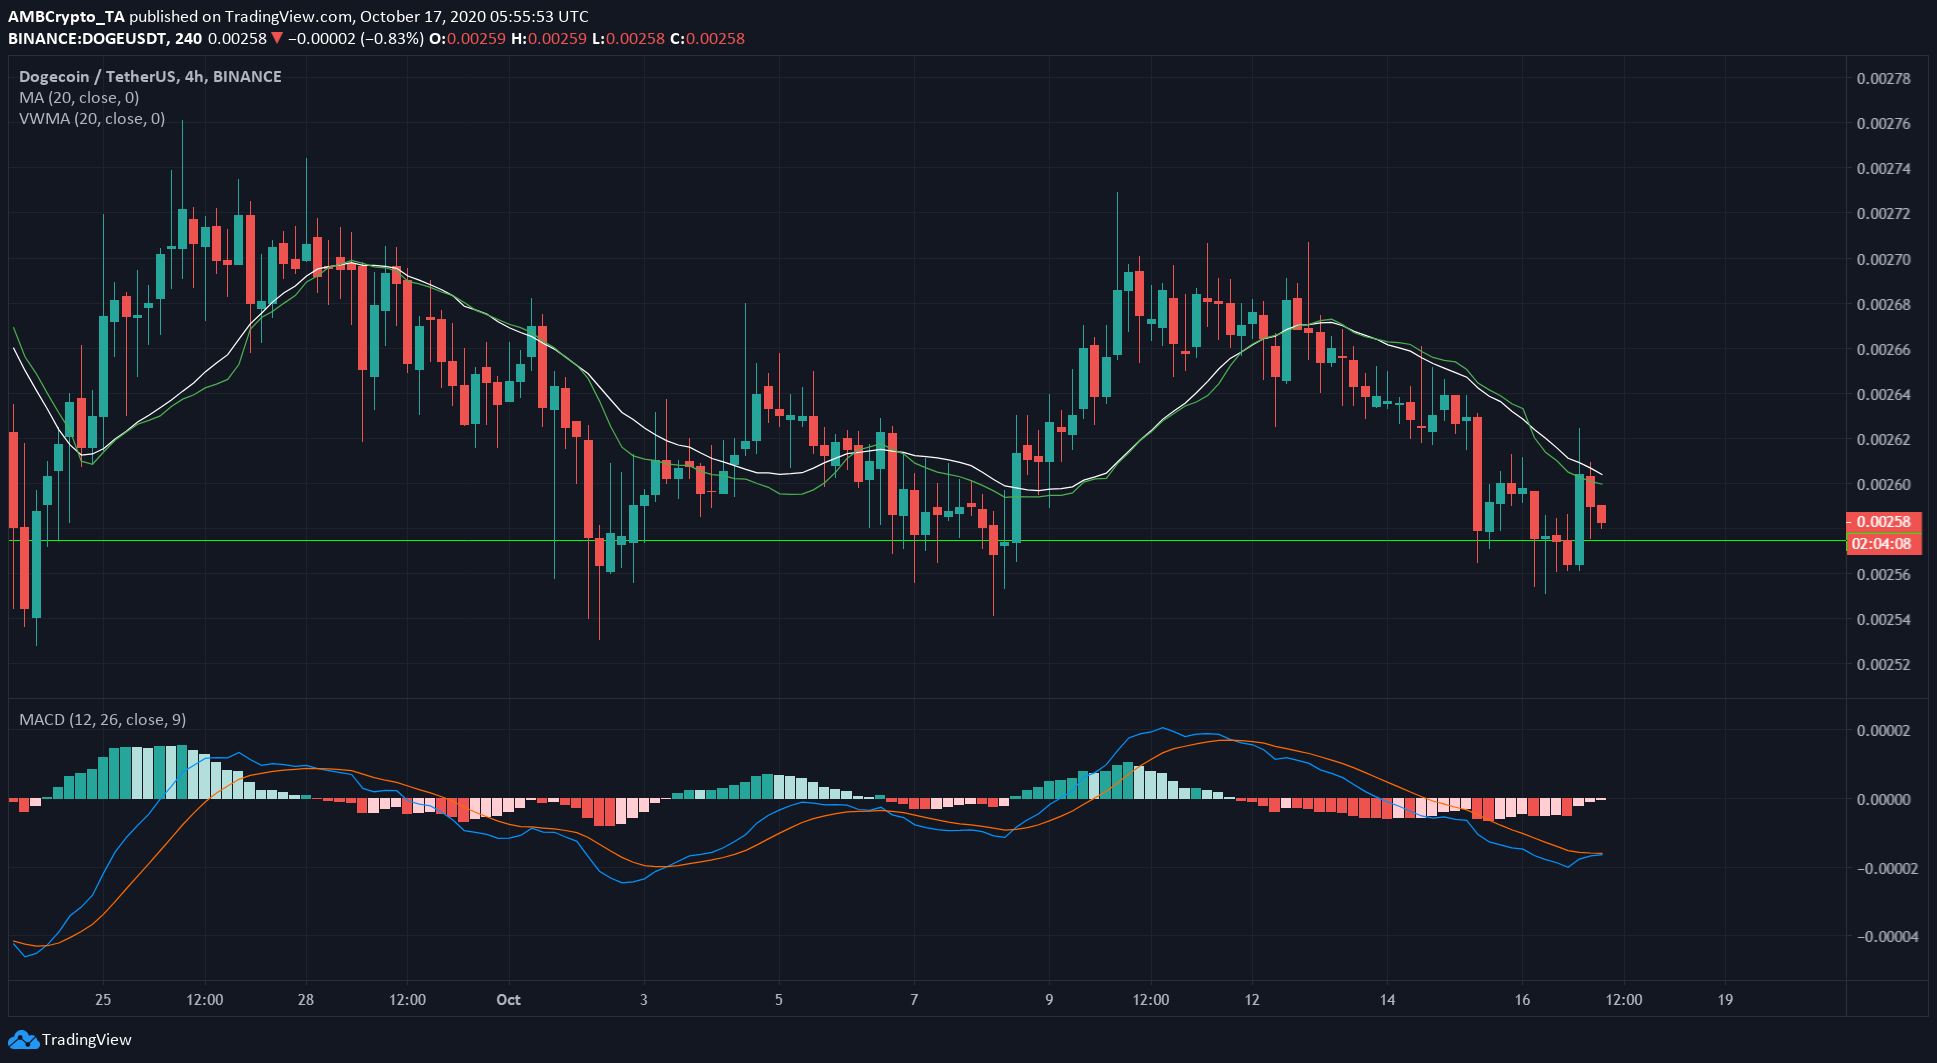
Source: DOGE/USDT on TradingView
The 20 period VWMA (green- volume weighted moving average) snaked beneath the 20 period SMA (white), showing that there was momentum in the past few hours for DOGE to the downside.
The MACD was still showing a strong sell signal, but a bullish crossover beneath the zero line might occur if DOGE bounced off support at $0.00258.