Analysis
Bitcoin might surge from wedge to $10.8K by January

Just over a week ago, Bitcoin touched the $6500 mark, which was last seen in May, earlier this year. BTC has made a respectable recovery since then, valued at around $7365 at the time of writing. Bitcoin has a market capitalization of nearly $134 billion, and almost $17.8 billion worth of BTC was traded in the last day, according to CoinMarketCap. It was traded most on the BKEX exchange, which accounted for just above 3% of the trade volume over the 24-hour period.
Bitcoin 1-day chart

Source: BTCUSD on TradingView
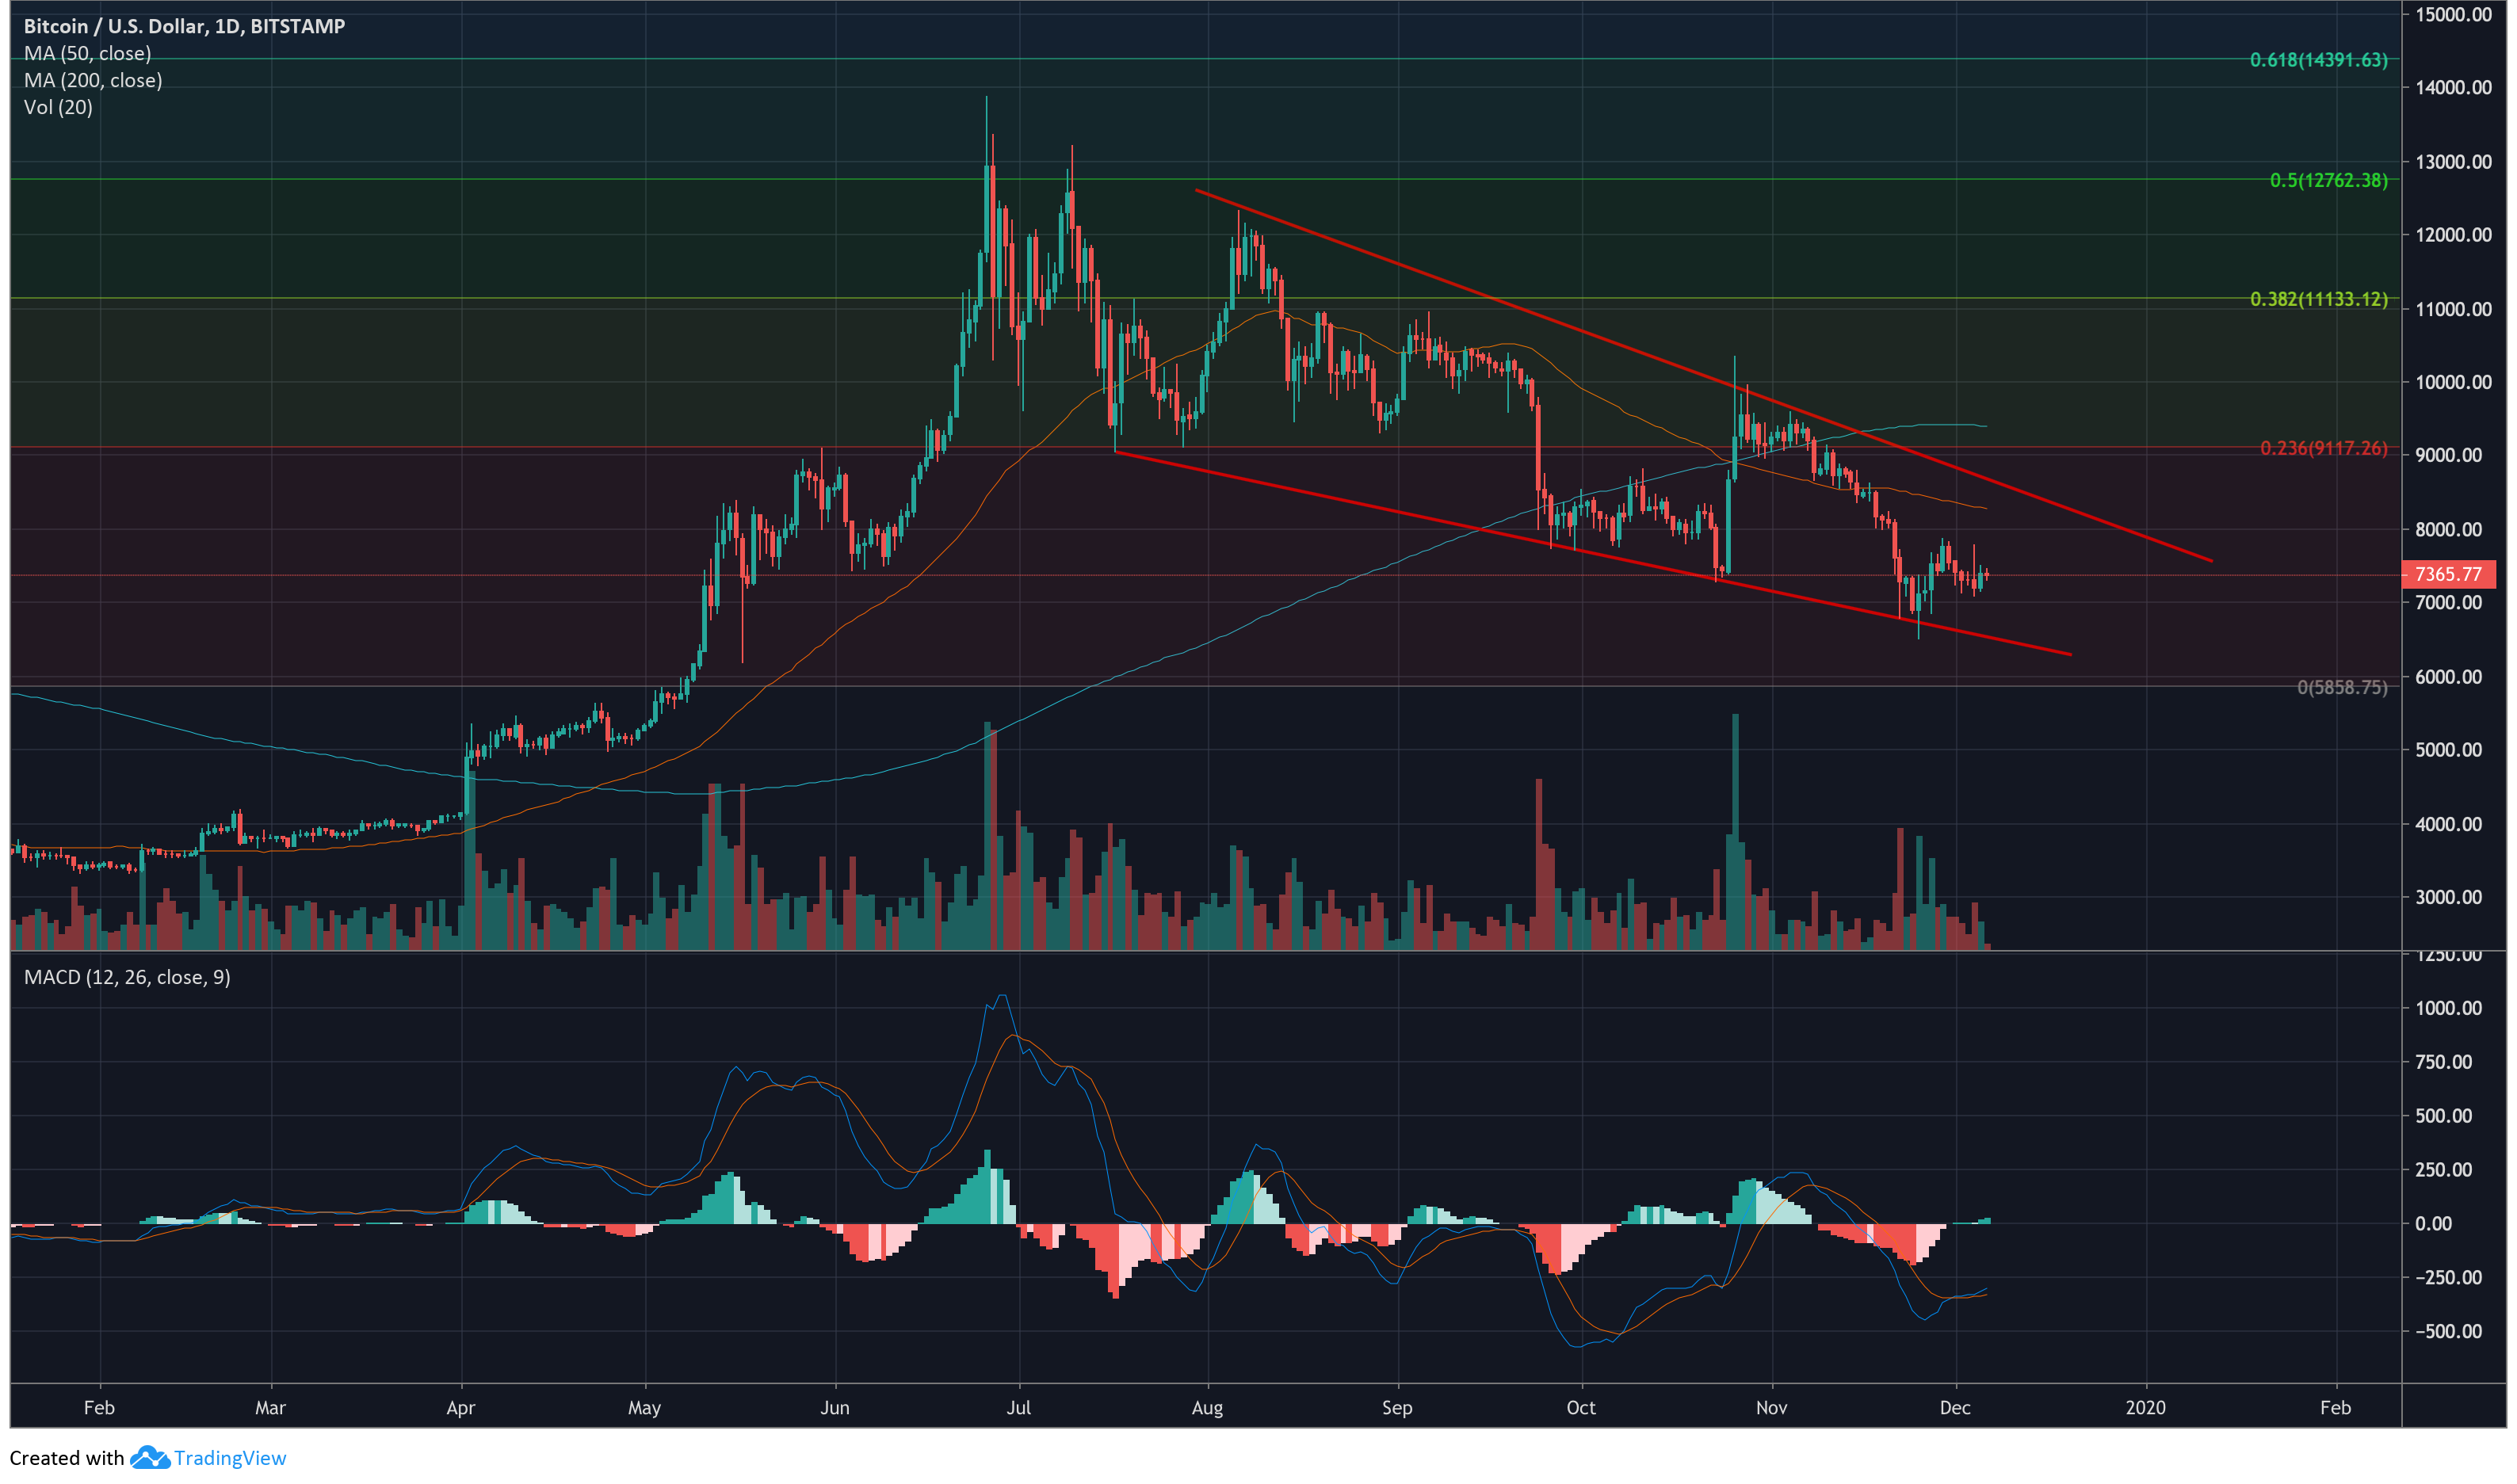
A look at the 1-day chart showed Bitcoin entering a falling wedge pattern sometime around mid-July, with the price oscillating between the two trend lines since. Volume trend over the period can be seen to be decreasing, which aligns with 75% of cases for falling wedge patterns. These patterns exhibit upward breakouts 68% of the time, lending a strong case for a potential bullish movement.
MACD showed a recent bullish crossover, with the signal line moving under the MACD line. Both lines appeared to be moving near the -320.00 mark, and exhibiting a weak bullish momentum. Both the 50 and 200-day moving averages, fairly reliable indicators of long-term price movement, appeared to be applying a bearish load on the Bitcoin price line, especially after the death cross which took place near the end of October.
After BTC dropped in value at the end of September, Bitcoin has been unable to cross back up over the 23.6% Fibonacci retracement line, save for a couple of weeks in November where Bitcoin crossed $9,000 before retracting back to its current value. Indicators show it is quite likely Bitcoin will continue through the pattern, and may breakout upward in the long term. This movement could see BTC rise up to nearly $10,800 before February 2020.

