Analysis

Bitcoin looks to breakout above descending channel, but bearish sentiment may limit upward momentum
Posted:

Bitcoin was trading at $10,105 at the time of writing, with the coin recording a fall of 0.83% over 24 hours. The king coin has maintained its position above $10k since its fall on 19 September, with its price fluctuating between $10,100 and $10,350.
1 hour
Source: Trading View
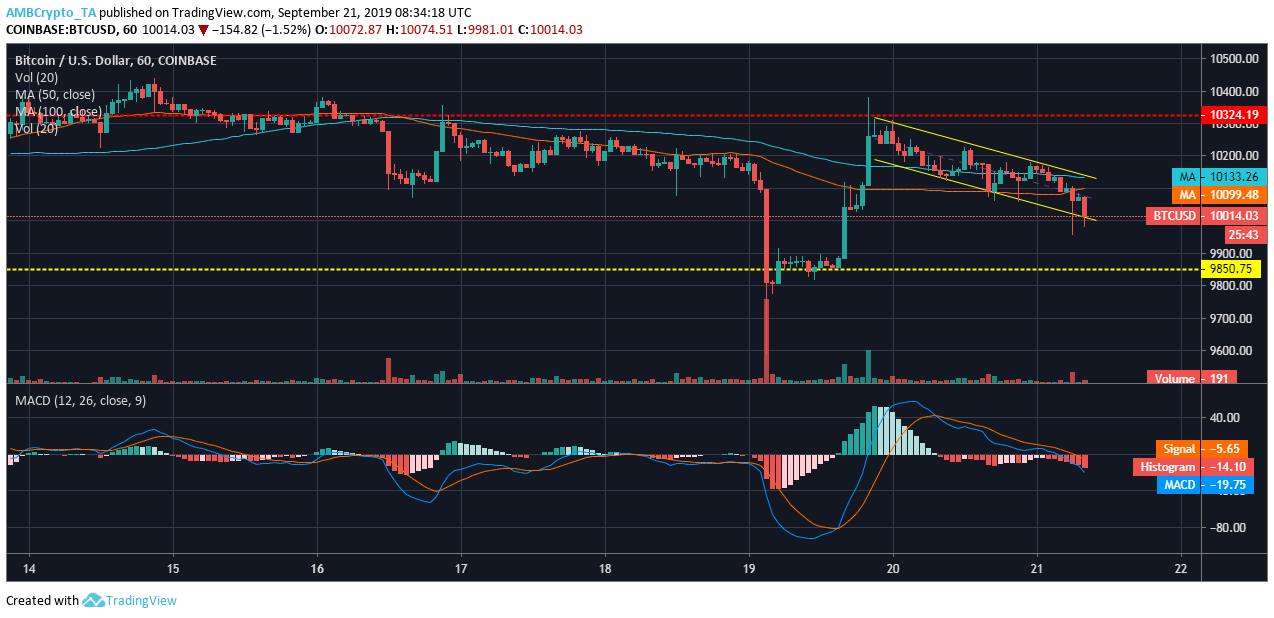
On the 1-hour price chart, Bitcoin is forming a support at $9,850, while the immediate resistance that it needs to break out from stands at $10,324. Bitcoin broke the aforementioned resistance once on 19 September and since then, the price has been less volatile.
Bitcoin is forming a descending channel characterized by two parallel lines; the upper trend line is bridging the lower highs at $10,300, $10,230 and $10,169. The lower trend line bridged lower lows at $10,130, $10,82 and $10,62. The formation of a descending channel is a bullish sign, and Bitcoin might as well test the immediate resistance at $10,324.
The 50 moving average line continues to move below the 100 moving average line, suggesting some bearish momentum in the short-term market. The MACD line is also moving below the signal line, which also suggests that the sentiment in the market is bearish. Thus, any breakout from the descending channel might be upwards, but since the bearish sentiment is on the higher side, it might not be able to break past the immediate resistance.
4-hr
Source: Trading View
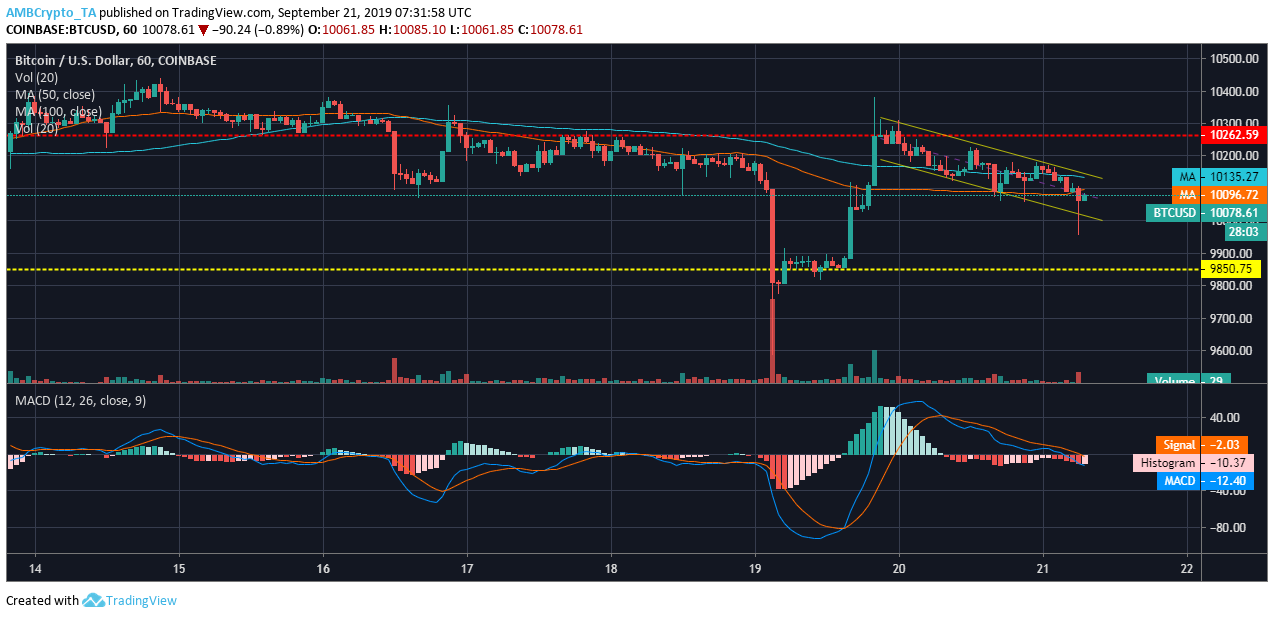
On the 4-hour price chart, the immediate support is forming at $9,764, while the immediate resistance is at $10,594. BTC is forming another descending channel characterized by two parallel lines; the upper trend line is bridged at higher lows starting at $10,457, $10,419 and $10,315. On the lower trend line, the lower lows are bridged at $10,152, $10,105 and $9,993. The formation of the descending channel is a bullish sign and the price might break above the descending channel.
The 50 moving average is under the 100 moving average, suggesting bearish momentum. The MACD line is above the signal line, suggesting a bullish sentiment. The 4-hour price chart looks to be on the bullish side.
Conclusion
Bitcoin is more bearish on the 1-hr price chart, while it seems to be bullish on the 4-hr chart. If Bitcoin manages to break out of the descending channel, it might see upward momentum. However, that momentum might not be strong enough to spur a price rally.