Bitcoin
Bitcoin long-term Price Analysis: 29 October

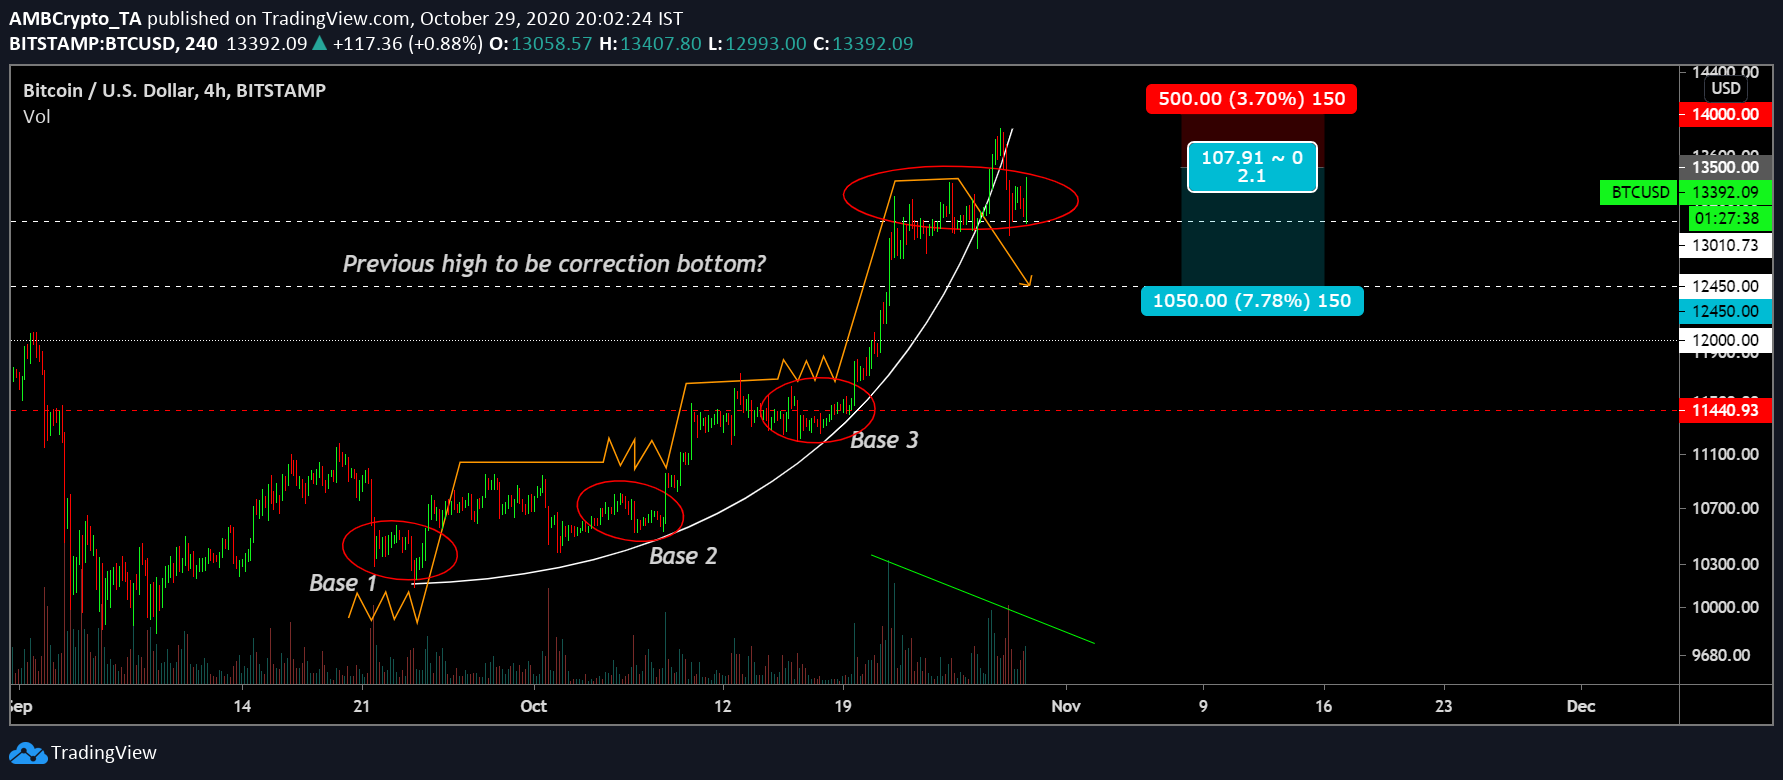
Bitcoin might be at the end of its current price rally after the asset clocked in a new-high at $13,884. While its sights were possibly set on a new position above $14,000, the recent drop might change proceeding going forward.
A period of correction might welcome Bitcoin over the next couple of weeks as the price moves into the penultimate month of 2020.
Bitcoin 4-hour chart

Source: BTC/USD on Trading View
While the 4-hour chart is typically indicative of a mid-term, it might suggest the direction of Bitcoin’s long-term price. As illustrated above, the asset is currently reaching a potential sell range at the end of its ascending parabolic curve. While the price did move beyond the actual range, it dropped back below $13,500. At the moment, the key support its price is looking at is at $13,001 and $12,450.
While the collective altcoin was already bearish, Bitcoin might join in anytime attaining strong corrections from its current top.
Reasoning
Source: Trading View
Market indicators are suggestive of a strong sell period. Relative Strength Index or RSI has witnessed a couple of over-bought positions over the past week, as the buying pressure began to dwindle in the market. While it seems like the RSI is pulling through for a bounceback, Awesome Oscillator suggested the bearish shift is already taking place.
The AO indicator revealed the improving bearish momentum which might take charge of the trend in the coming days.
Conclusion
After analyzing, a short-position can certainly be ideal for Bitcoin, with a quick entry at $13,500. The stop-loss can be pitched at $14,000 which might remain elusive to Bitcoin for now. Taking profits at $12450 will complete a Risk/Reward ratio of 2.1x, upon which the price might continue to move sideways.

