Bitcoin
Bitcoin, Ethereum and XRP exhibit highest degree of correlation, 4-6% drop or surge?

The top three coins based on market cap, Bitcoin, Ethereum and XRP have been in the same boat as that of stocks and traditional assets, which have both dropped by historic levels. However, the Bitcoin and the larger cryptocurrency ecosystem might just be decoupling from the stock market.
The cryptocurrency market’s correlation with Bitcoin, however, is another story. According to CoinMarketCap, the most traded cryptocurrency [excluding stablecoins] is Bitcoin, following which is Ethereum. XRP ranks 7th in terms of the 24-hour trading volume.
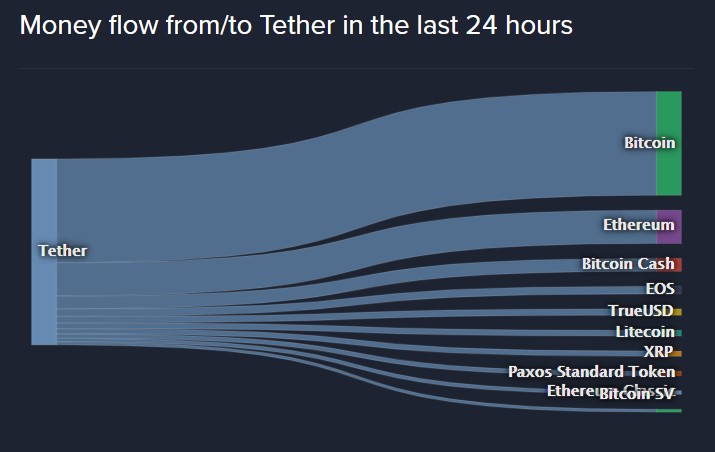
This high trading volume means, mostly Bitcoin and Ethereum are being traded and hence show high liquidity. Additionally, most of the capital flows into these two cryptocurrencies. According to Coinlib, Tether’s 24-hour trading volume was at $15 billion and 7.83 billion of this volume is going into Bitcoin and 2.51 billion into Ethereum. Together, BTC and ETH control 68% of the total trading volume.

Source: Coinlib
A cliched quote that would serve the purpose here would be, “with great power comes great responsibilities”. That power was seen when Bitcoin fell off the cliff and this might have caused the correlation between the top 3 coins to surge to the highest.
Source: Coinmetrics
Both BTC-ETH and the BTC-XRP correlations peaked on March 13, when the price fell. For now, the correlation seems to be moving sideways at the 0.93 level for ETH and 0.90 for XRP.
Price, where art thou headed?
With such a high degree of correlation, even a small yet sudden movement in Bitcoin’s price will be translated to the altcoins. In addition to this, there might separate dumping taking place with respective altcoins causing uncorrelated bearish movements, all of which are bad for the coin. At press time, Bitcoin, Ethereum, and XRP have all formed bearish patterns and can be seen in the chart attached below.
Source: BTC/USD TradingView
Bitcoin showed formation a descending triangle, which has a high chance of breaking down. Ethereum has formed a potential double top, a bearish and a top reversal pattern. XRP seems to have already started dipping below a crucial level.
For Bitcoin, RSI has finished peaking at the overbought zone and has begun its journey down South. This could continue, breaking the price out of the descending triangle and on to the next support at $5,885. This would mean that BTC would register a 4% drop from its current price.
The same can be said about Ethereum and its RSI. Additionally, a high correlation might ensure ETH’s drop later, regardless of what the charts indicate now. This could shed ETH’s price by 6% from its current position. As for XRP, the chart is already looking bearish. If the candle closes below $0.1604 support, there is an easy chance for the price to drop 4.56% to $0.1527.
Additionally, the price might undergo a surge for both ETH and XRP due to Bitcoin’s surge. If the price of Bitcoin surges higher, there might a chance that it completes the inverted Bart pattern as mentioned yesterday.
Conclusion
All the top 3 coins seem ready for a correction. BTC and XRP might witness a 4-5% drop, whereas, ETH might see a 6% drop to $125. Even if the individual coins show bullish signs, it will be negated if Bitcoin is bearish owing to an ATH correlation between them. Alternatively, a bullish surge in Bitcoin’s price will negate the bearish pressure in altcoins.

