Bitcoin
Bitcoin drops below $93K amid selloffs – Is a short-term bounce coming?
Can Fibonacci levels and market sentiment support a bounce?

- BTC’s short-moving average has continued to serve as resistance
- At press time, the funding rate was positive, despite the decline
The cryptocurrency market saw significant volatility as Bitcoin (BTC) dropped below its critical $93k support level, before recovering again This movement raises concerns about further declines, but also sparks speculation about a potential short-term recovery.
Hence, let’s analyze the data.
Bitcoin’s price action – Key support breached
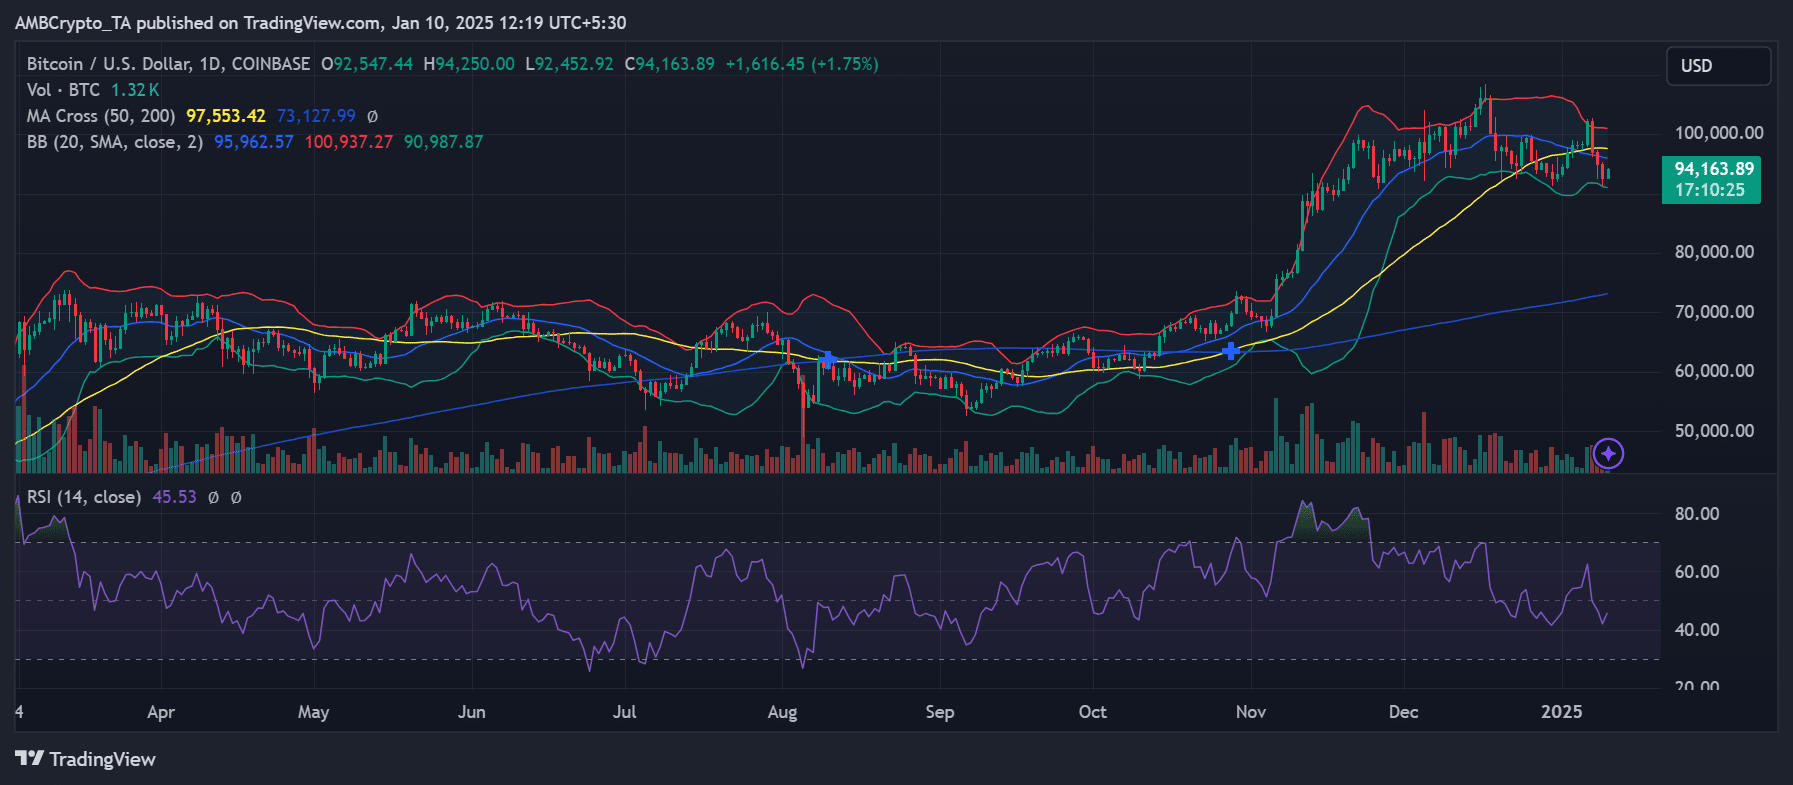
The price chart illustrated Bitcoin’s recent decline, showcasing a break below the $93k threshold after a period of consolidation. The drop was accompanied by greater sell pressure, as indicated by rising volumes. Notably, BTC struggled to maintain its position above the 50-day Moving Average (MA), while the 200-day MA at $73,128 remains a long-term support.
Bollinger Bands underlined the volatility surge, with Bitcoin nearing the lower band at $90,987. This pointed to oversold conditions, which could trigger short-term buying interest on the charts.
Exchange netflow highlights sell pressure
The exchange netflow chart revealed a significant uptick in outflows recently, coinciding with Bitcoin’s drop below $93k. Although the netflow was positive on 9 January with around 3,000, it has been negative since 3 January. These outflows alluded to heightened sell pressure as investors moved assets to exchanges, possibly to liquidate holdings.
However, despite this, the broader market narrative remains intact. A sustained reduction in netflows could support price stabilization.
Fibonacci levels hint at possible bounce
Using the Fibonacci Retracement indicator, Bitcoin’s immediate support lies at the 0.382 Fib level ($93,311). The 0.618 Fib level at $101,849 serves as a potential recovery target if bullish momentum builds.
Historically, these levels have acted as pivotal zones for trend reversals or continuations.
The relative stability around the $93k level suggested an ongoing battle between bulls and bears. A decisive close above $95k could reinforce a short-term bounce, while failure might lead to a retest of lower Fib levels.
Funding rates and market sentiment
Funding rates across exchanges provide insight into market sentiment. Positive funding rates (indicating long positions outnumber shorts) have been moderating, reflecting caution among leveraged traders.
An analysis of the funding rate revealed that though it remains positive, there have been notable declines over the last few days.
A decline in funding rates during the recent sell-off pointed to bearish sentiment and reduced confidence in the crypto’s immediate recovery.
Bounce or breakdown?
Bitcoin’s press time trajectory highlighted a precarious balance. While technical indicators pointed to a possible short-term recovery, the prevailing market sentiment seemed to lean bearish. Key levels to watch include $93,311 for support and $95,000 for a bullish pivot.
– Read Bitcoin (BTC) Price Prediction 2025-26
The coming days will be critical in determining whether Bitcoin can bounce back or succumb to further downside pressure.


