Bitcoin
Bitcoin could rise to $9100 next week after brief dip to $8400

After spending most of its time between $6800 and $7400 since late-November, Bitcoin finally took off on January 3, rising by 30% over the past two weeks. At the time of writing, BTC was valued at around $8645, with a market capitalization of over $158.5 billion, according to CoinMarketCap. Further, nearly $35 billion worth of BTC was traded in the last 24 hours.
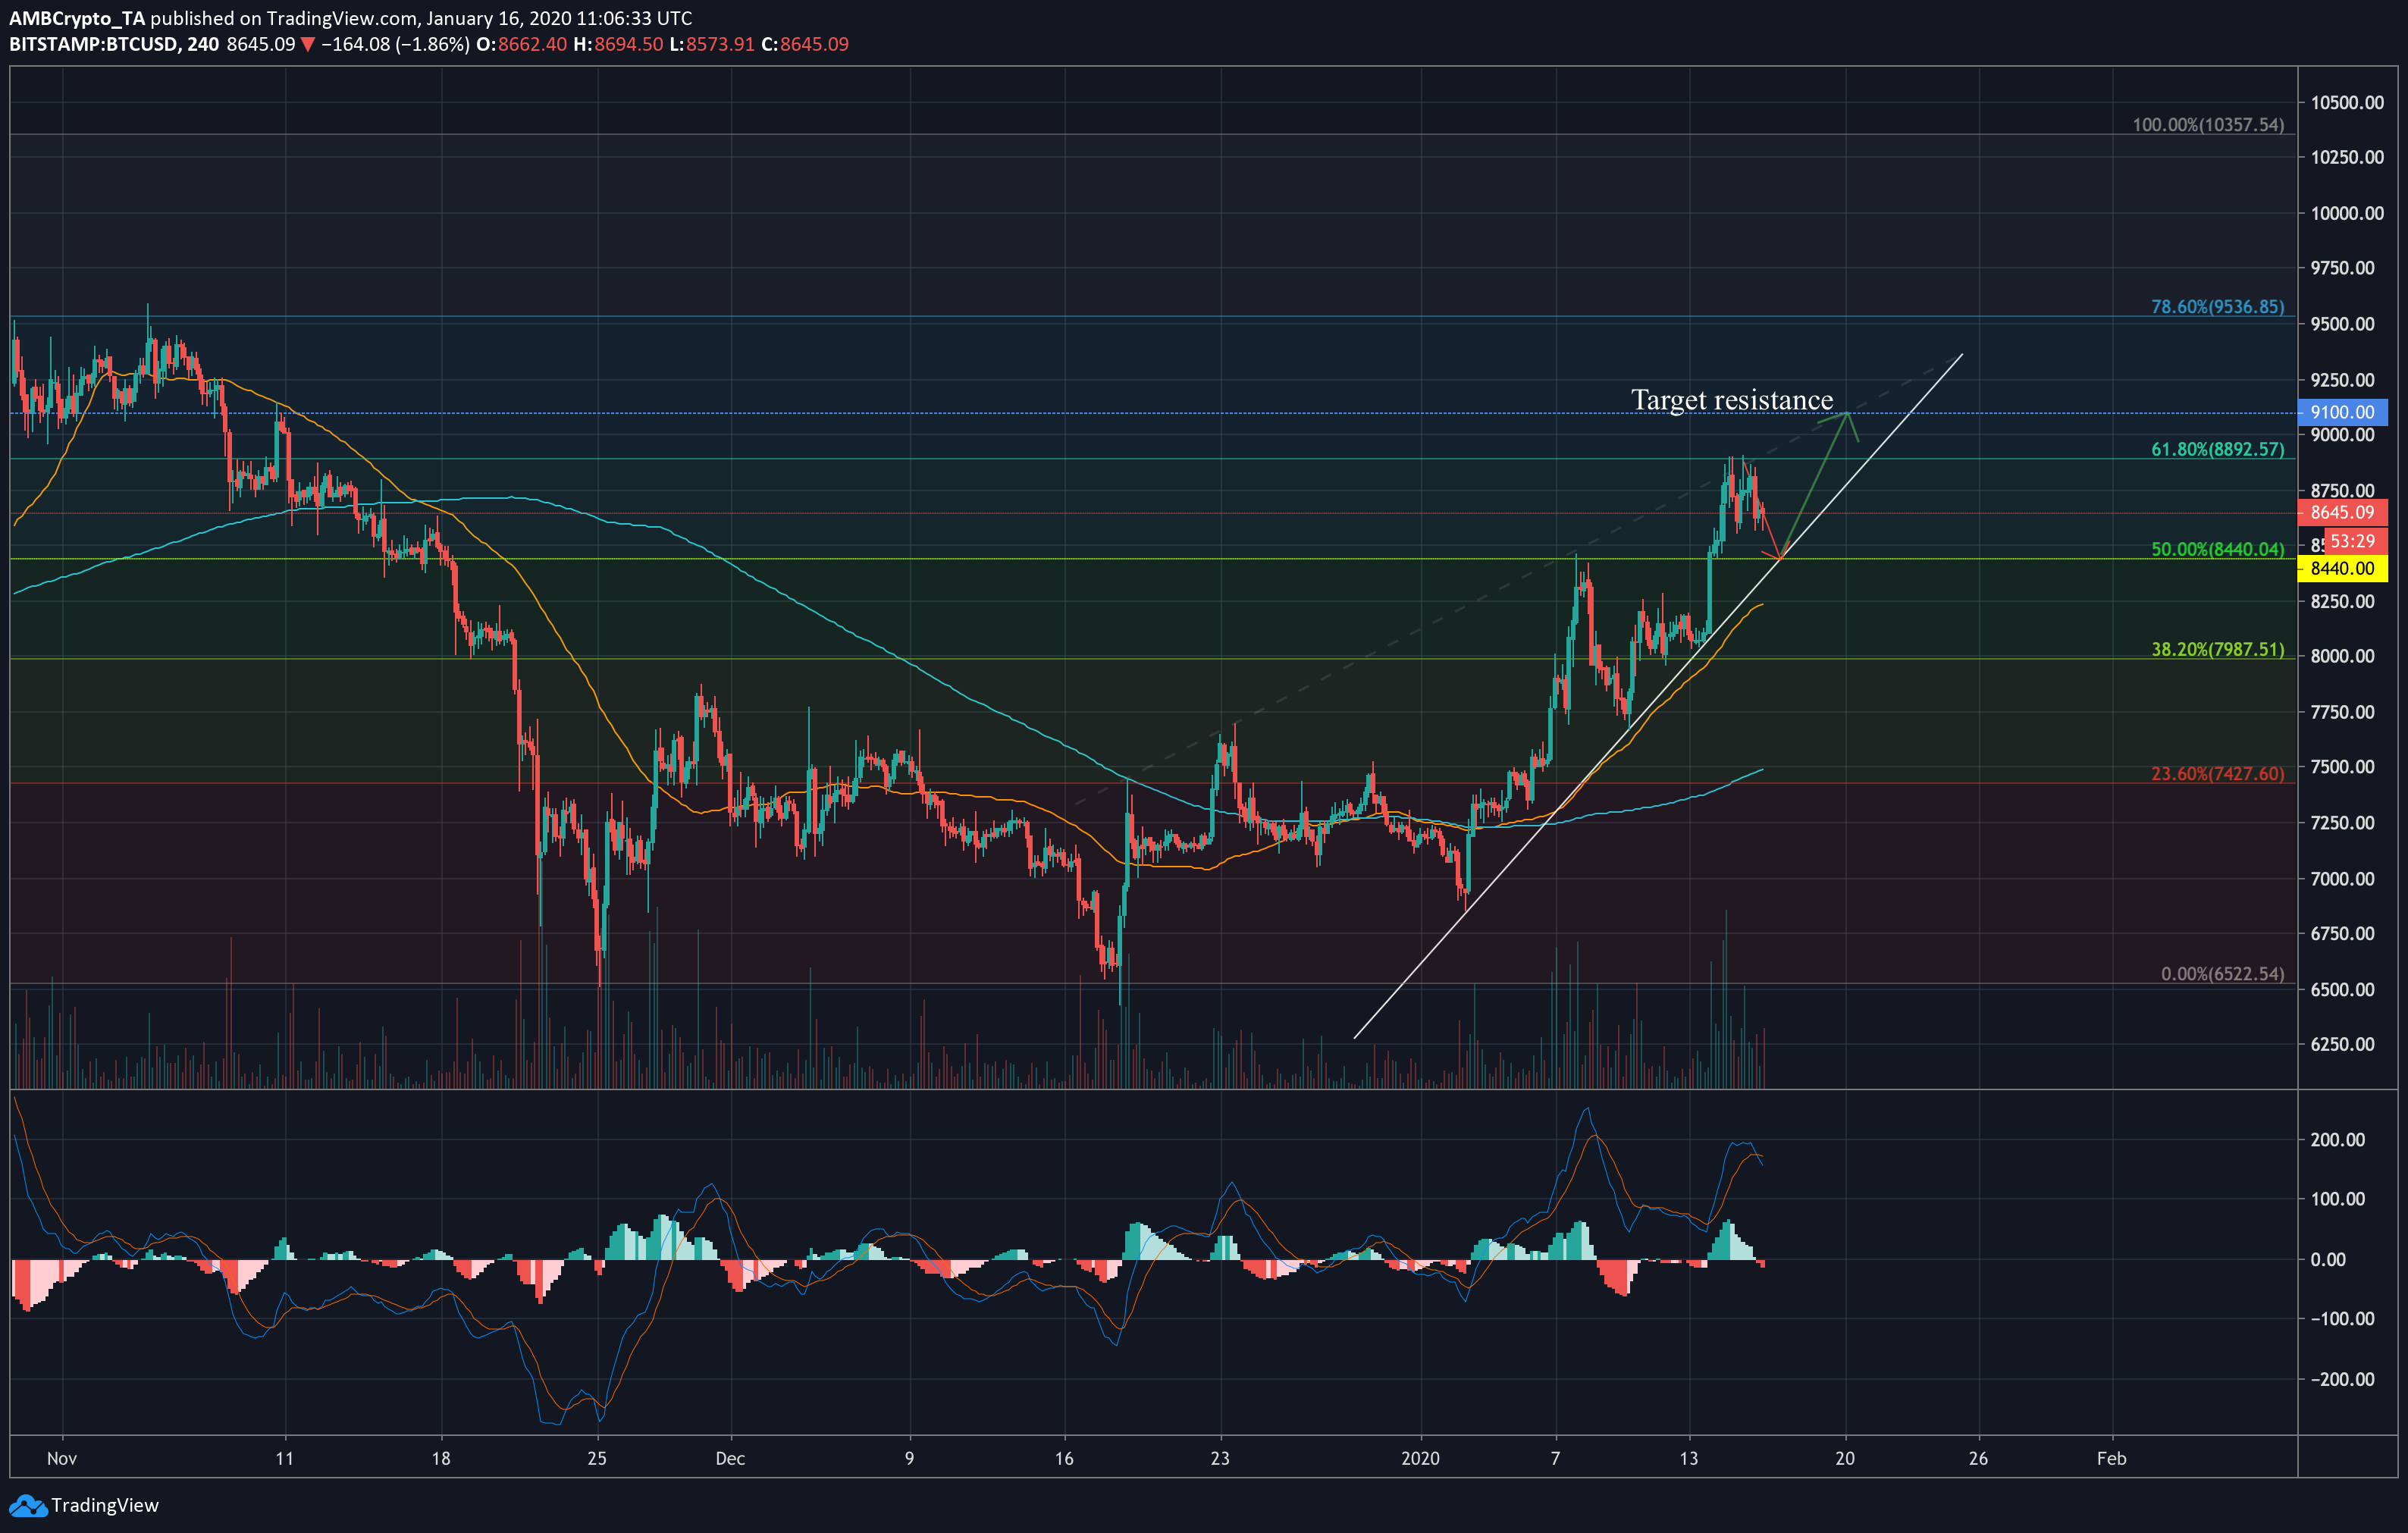
BTC 4-hour chart

Source: BTCUSD on TradingView
The above BTC 4-hour chart showed that the price has been constantly testing the shown trend line since January 3, and made steady upward progress to nearly the $8900 mark before falling to its current value. If this pattern should continue, a drop back down to the trend line, at $8440 seems all but certain in the coming days.
As shown above using a faded dotted line, it is possible to construct a rising wedge pattern from Bitcoin’s price movements over the last few weeks. However, with such steep rises in recent times, using this pattern to predict price movements has not been successful in the past.
The 50 and 200-day moving averages were both seen moving under the price line, having broken out of the death cross which took place in mid-November within the first few days of the year. The 50-DMA could also be seen close to the trend line as it rose upward with BTC price over the last couple of weeks.
This is usually quite a bullish signal, and could be indicative of a rise in Bitcoin’s value. MACD was less optimistic on the 4-hour time-frame, indicating a bearish market as the signal line was seen having crossed over the blue MACD line. Despite being indicative of a downward movement, the MACD histogram showed that bearish momentum was low, meaning Bitcoin could be in for a short dip before rising up in value.
Further, each rise in value along the trend line had been associated with spikes in trade volume. As the volume looked to be lowering toward the end, a rise in value is unlikely to occur before a small dip downward. Rise from the $8440 level would likely push Bitcoin up to the $9100 resistance level in the next seven days. However, should the price drop below the trend line, BTC could sink to just under the $8000 level.
Bitcoin SOPR
Source: Glassnode
Glassnode’s Spent Output Profit Ratio (SOPR) metric measures overall market profit and loss by calculating the profit ratio of coins moved on-chain by quantifying the variation between purchase price and sale price. According to Glassnode data, Bitcoin’s SOP ratio was at 1.012 as of January 15, dropping from 1.022 a day before.
This validates the hypothesis that Bitcoin will make a brief dip downward in the short-term. When SOPR value is above 1, selling the asset is more profitable, leading to increasing sell volume until the metric is pulled back to 1 or below. However, it is important to note that the SOPR tends to intermittently correct itself under 1 during bull markets, which could set the precedent for the aforementioned rise above $9000.
Conclusion
With both moving averages under the price line painting a traditionally bullish picture and the pattern of Bitcoin movements over the last few days, we might see a rise above $9000 before next weekend. Bitcoin’s SOPR looks to be dropping, possibly indicating a bullish market. On a separate note, if we assume the price is moving through an anomalous rising wedge pattern, a breakout from $9100 to $10,350 is possible in the coming weeks.

