Bitcoin has seen some stellar performance this year, despite showing a dip in BTC dominance. Sporting a price tag of $9972 at the time of writing, Bitcoin’s dip under $10,000 might raise alarms for some investors. However, this corrective movement looks to be nothing but a small detour on BTC‘s journey upward.
CoinMarketCap reports Bitcoin has a market capitalization of over $182.3 billion, with over $46 billion worth of BTC traded in the last 24 hours.
Bitcoin 1-day chart
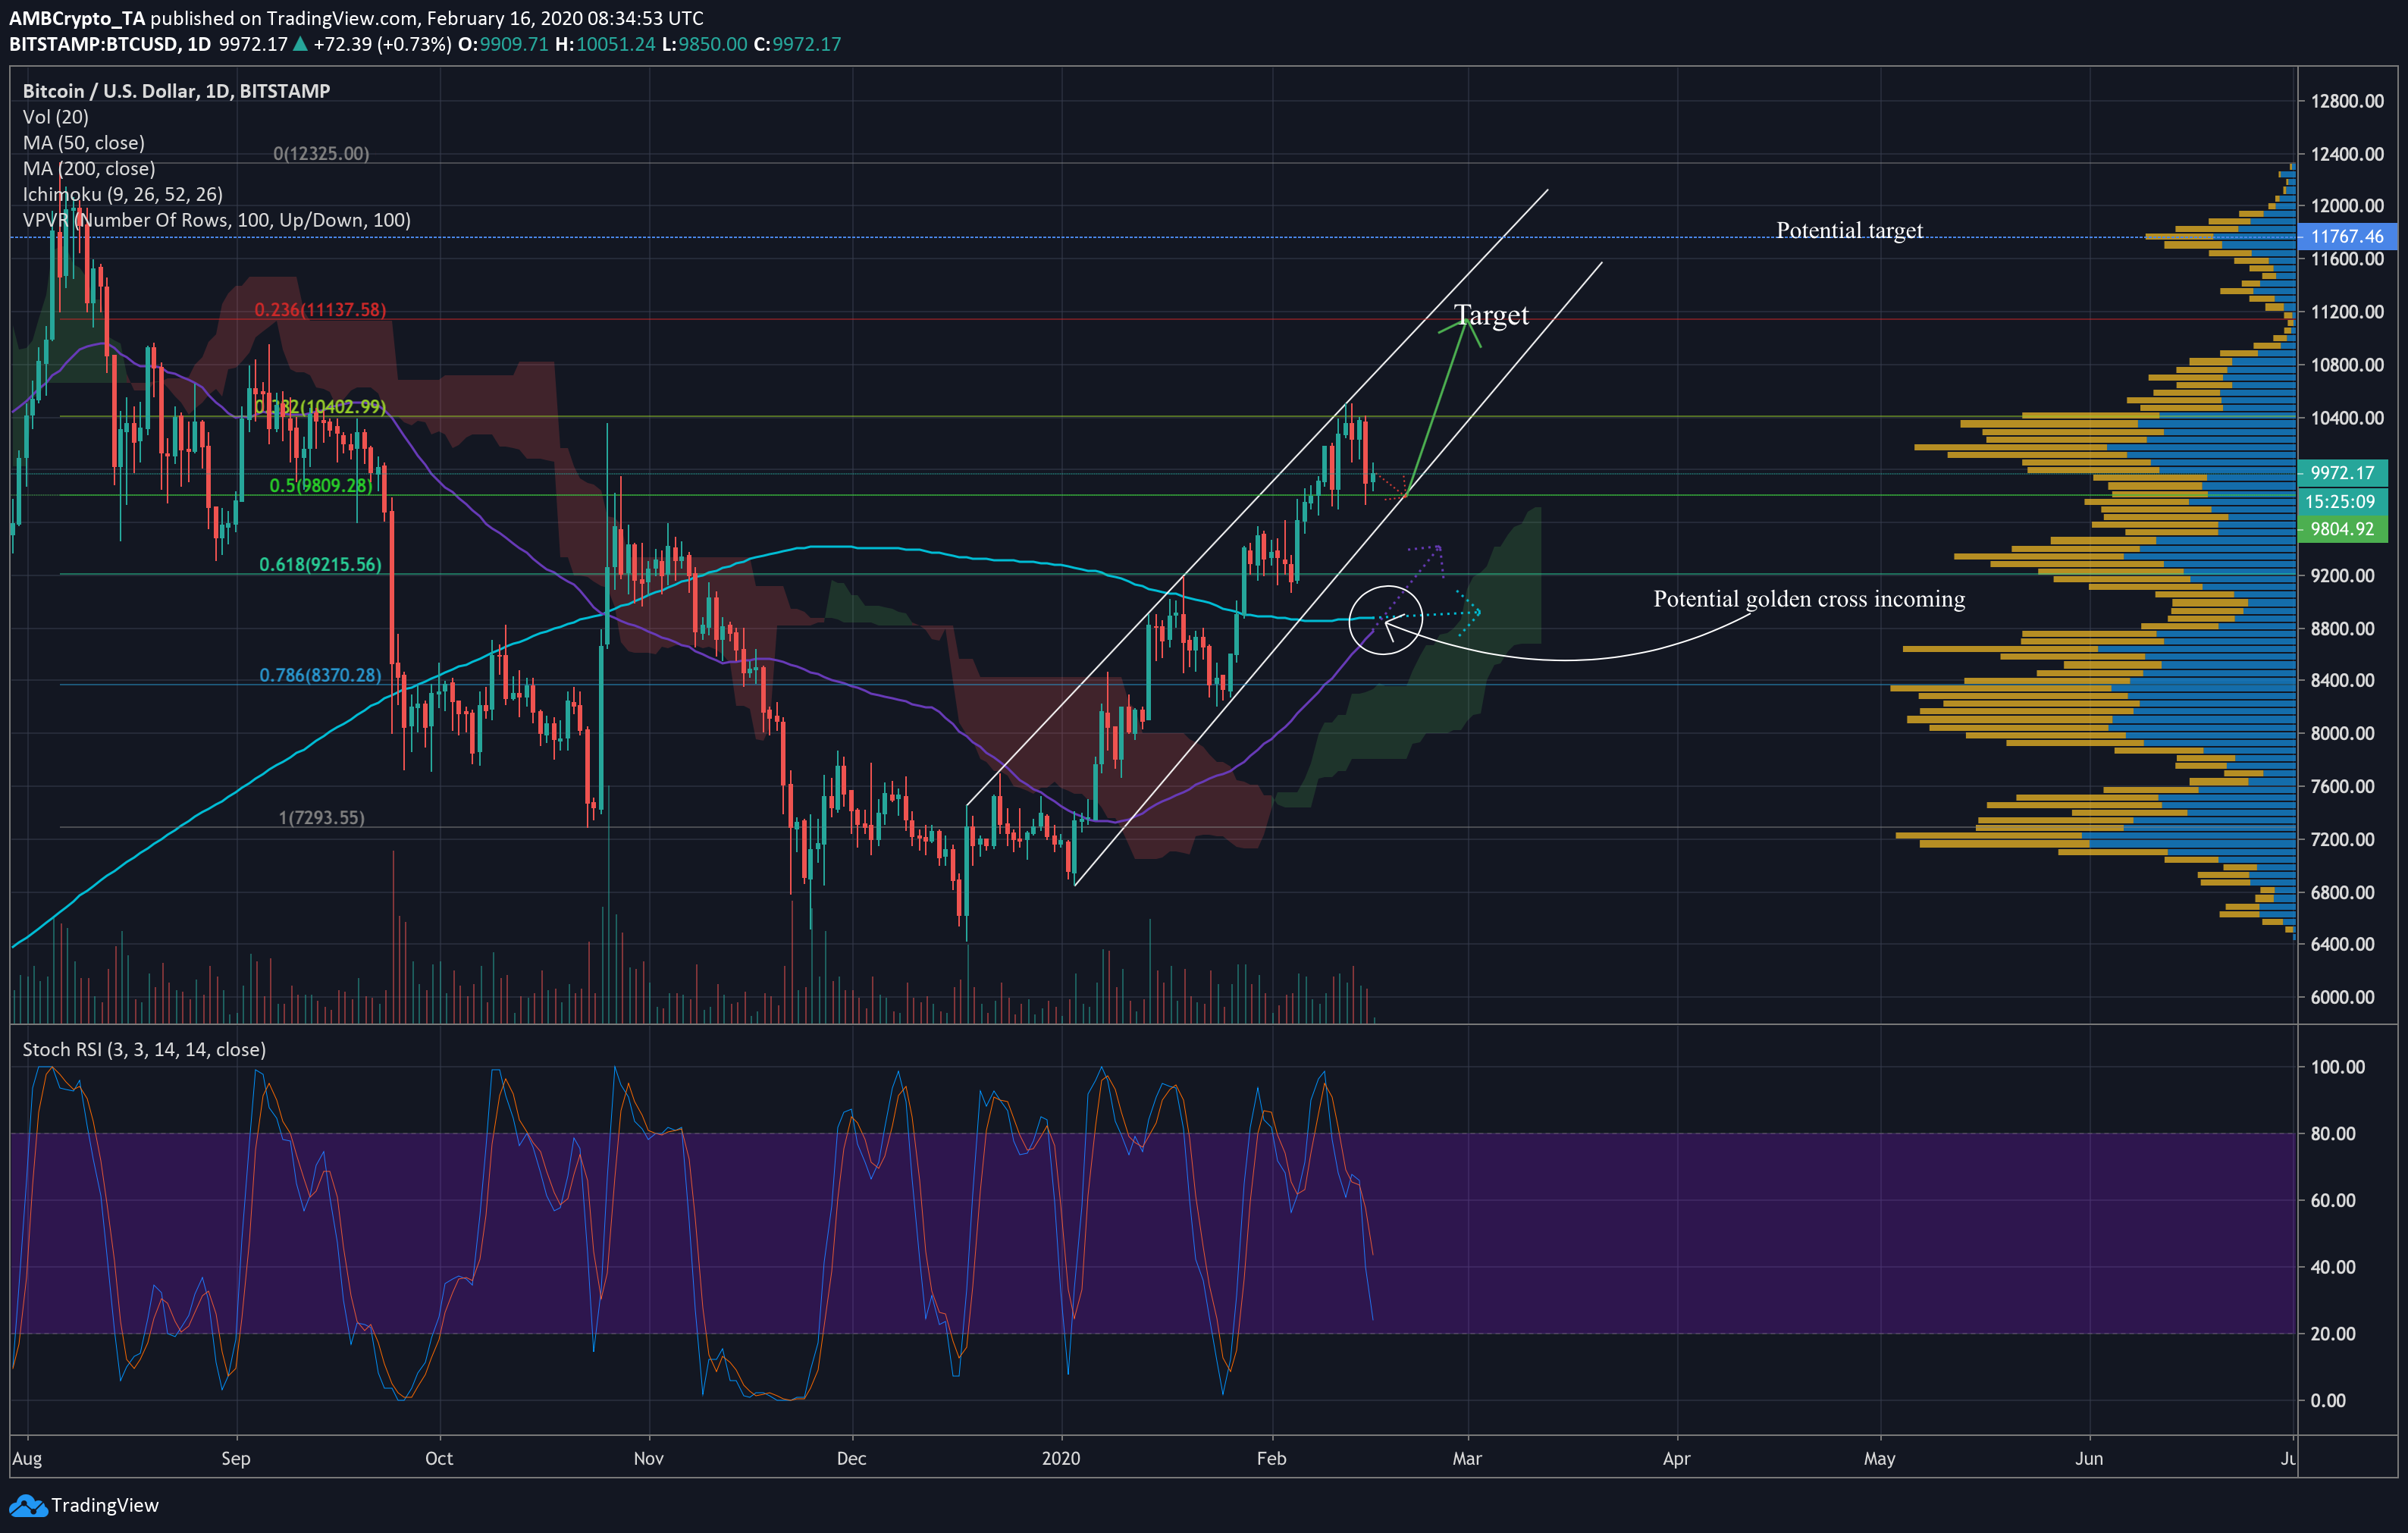
Source: BTCUSD on TradingView
Bitcoin appeared to be moving through a rising wedge formation and has been shuttling between the trend lines since mid-December. These patterns exhibit downward breakouts in 60% of cases, and while a breakout may not be in sight in the near future, the downward movement seems unlikely in the coming days and weeks.
For starters, 50 and 200-day moving averages were poised to move finally into a golden cross, after entering a death cross in late October. This could indicate a strong bullish movement in the short to medium term.
Ichimoku Clouds were moving well under the price, which is already quite a bullish signal. However, the conversion line was also moving above the baseline (not shown in chart), further solidifying the bullish case for Bitcoin in the near future.
Stochastic RSI indicated that a buy-point is approaching. Twice in 2020 alone, this indicator has reported buy signals as the indicator dipped under the 20.0 mark. With the StochRSI diving down at the time of writing, we could see a buy signal coinciding with the potential golden cross next week.
Positive signals from technical indicators predict an upward price movement in the medium term, and BTC could rise to the $11,200 mark following some sideways movement over the next week. However, considering the presence of a low-volume node at $11,200, Bitcoin could rise further to the $11,600 to $11,700 higher volume nodes in the weeks following BTC meeting the price target.
Number of addresses with >0.1 BTC
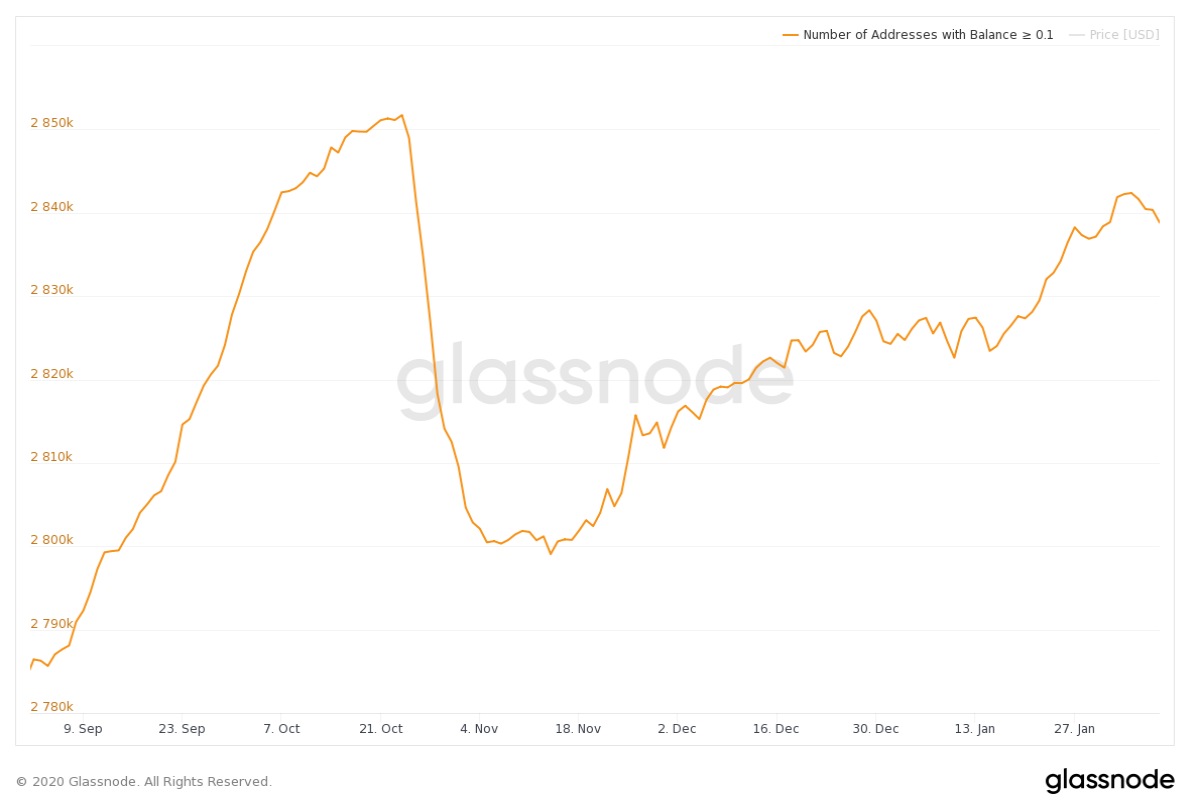
Source: Glassnode
Data from Glassnode showed the number of addresses holding more than 0.1 BTC has been rising since mid-November, after a dip of around 500,000 addresses toward the end of October. The number of addresses also saw a spike in mid-January, after Bitcoin crossed the $9000 mark. This could mean that more users are choosing to HODL Bitcoin, with the halving event just around the corner.
Despite falling BTC dominance, investors are still increasingly putting their money into Bitcoin this alt-season, which could imply further price appreciation in the short to medium-term.
Conclusion
Strong positive signals from technical indicators likely mean BTC will move up in value in the coming weeks. The potential for a golden cross coinciding with a buy-signal from the stochastic RSI could also provide a better environment for price appreciation. Considering more addresses are increasingly holding more BTC in recent times, Bitcoin could push to the 23.6% Fibonacci retracement line at the $11,200 level by the end of the month, with the possibility of an additional pump to around $11,650 at the next high volume node in the weeks that follow.