Analysis
Bitcoin could break out of descending channel to $7900 before next week

Bitcoin’s price drop during the end of last month caused the price to oscillate around the $8000 mark for the past few weeks. Though Bitcoin has definitely seen better days, it gets credit for its 25% since last October.
Bitcoin dipped below $8000 once again today, with a valuation of around $7960 at press time. According to CoinMarketCap, Bitcoin’s market capitalization stood at $145 billion, with a trading volume of over $15.7 billion and a decrease in valuation of 2% over the last 24 hours.
1-hour chart

Source: BTCUSD on TradingView
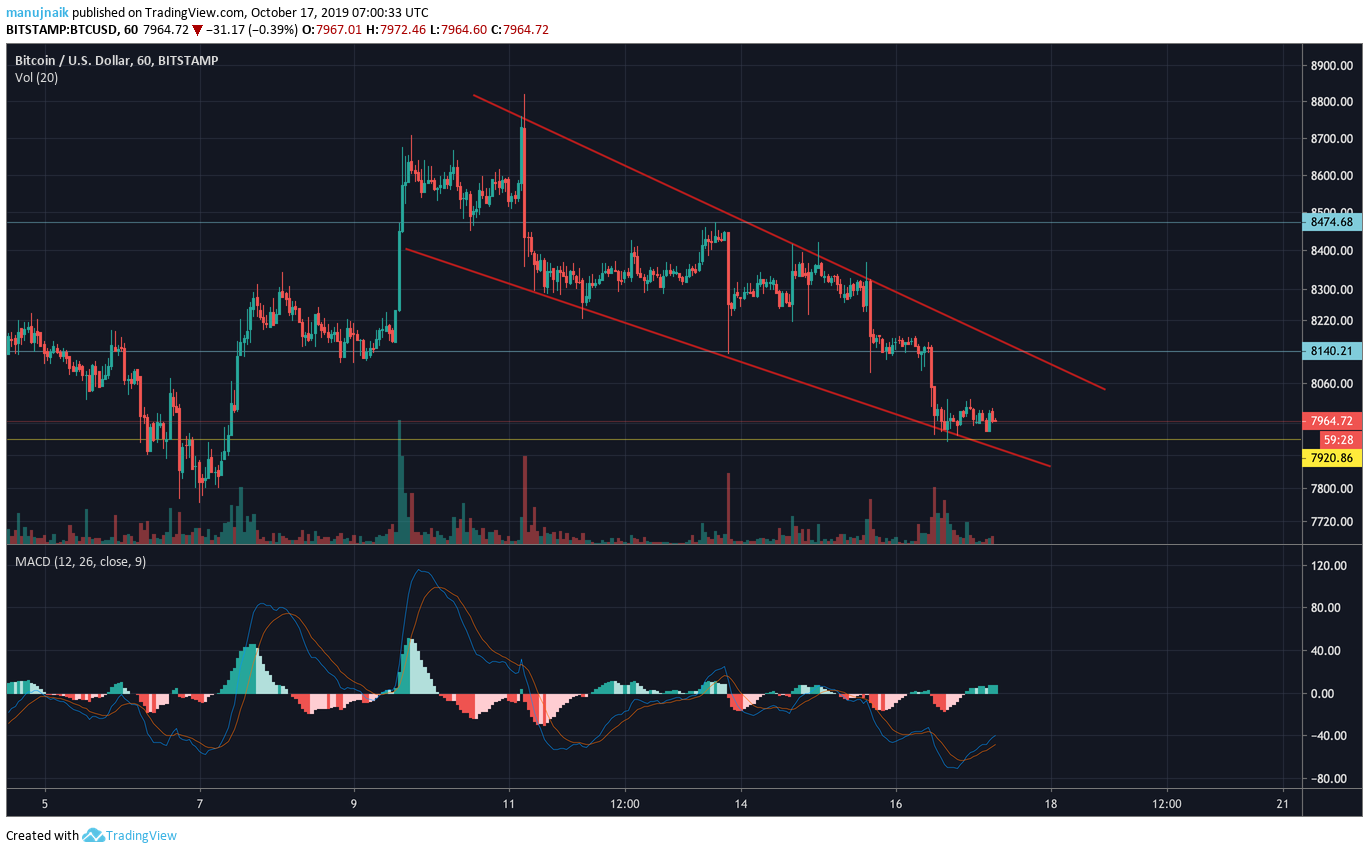
The 1-hour chart showed BTC entering a pennant during the second week of October. A pennant is formed when price movement is marked between two converging lines for a time duration of less than three weeks. The decreasing volume trend for the pattern’s duration further supported the premise that the price is moving through a pennant.
MACD showed a recent bullish crossover, and since pennants break out upward 57% of the time; an upward movement is more likely in the near future. The price is likely to continue upward through the pennant before possibly breaking out to $8250 before the end of the week.
4-hour chart
Source: BTCUSD on TradingView
However, the 4-hour chart showed that Bitcoin’s price trend entered an ascending channel soon after the price dropped toward the end of last month. These patterns generally exhibit bearish breakouts, and EMA ribbon lines which are beginning to diverge over the price line indicated a movement below the bottom trend line, down to $7850 in the coming week.
Coming back to the 1-hour chart, the real test for the coin is when the price stands at the pennant’s upper trend line. Since pennants also have a 47% chance of a downward breakout, there is a chance that Bitcoin could rise up to $8100 in the next few days, bouncing back and breaking out of the pennant and ascending channel patterns to $7900 by the end of the week.

