Analysis
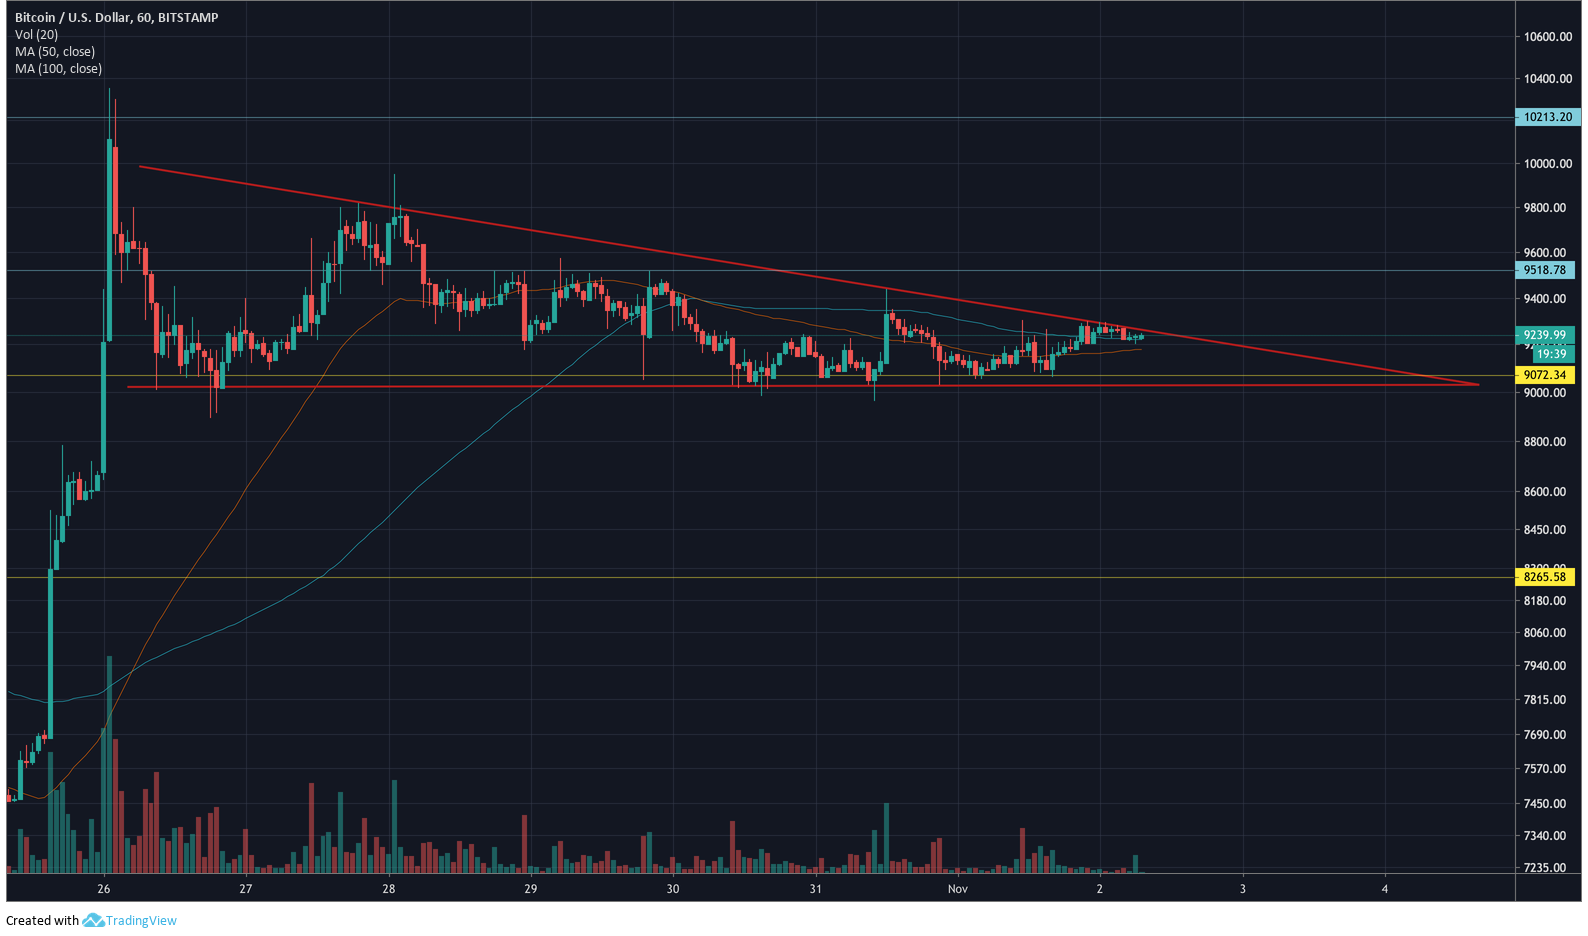
Bitcoin could breach descending triangle to either $9750 or $8800

Bitcoin, having recently celebrated its whitepaper anniversary, looks to be consolidating between the $9500 resistance and the $9000 support. With a value of $9240 at the time of writing, Bitcoin had a market cap of over $167 billion, and a daily trading volume of nearly $24 billion. BTC saw a 1.2% rise in the last 24 hours, and was traded most on the ChainX exchange, which accounted for 3.96% of trades.

Source: BTCUSD on TradingView
Bitcoin’s price looks to have entered into a descending channel pattern since late-October. The price has been moving between the pattern trend lines. The decreasing volume trend further confirmed this pattern.
The 50 and 100-day moving averages indicated a move upwards for Bitcoin price, as they lie just under the price line. However, they could be about to cross over the price line, causing a bearish movement.
Source: BTCUSD on TradingView
MACD also showed signs that a bearish crossover may take place soon, as the signal line looks to cross over the MACD line, while they both sit near the 20 mark.
For descending triangles, breakouts occur upwards 53% of the time. Which that’s only a little over 50:50 odds, it does make it more likely that the price will move up. As the trading volumes also become smaller and smaller, it seems more likely that the breakout will happen soon, possibly within the next few days.
As the price tests the upper boundary of the pattern trend, Bitcoin could see a rise up to $9750 in the coming days. If the price moves down, however, there could be a drop to $8800 by the middle of next week.

