Bitcoin Cash short-term Price Analysis: 28 October

Disclaimer: The findings of the following article attempt to analyze the emerging patterns in the Bitcoin Cash short-term market and its impact on the price.
While most of the cryptocurrency market was witnessing an upswing in the price movement, Bitcoin Cash was noting a downward trajectory on 26 October. The increase in selling pressure pushed the digital asset’s value lower to $252, after which the trend reversed. Bitcoin Cash managed to surpass various resistance levels and was currently trying to breach above the resistance at $269, which has been difficult despite two attempts.
The current value of BCH was $265.32, as it fights the selling pressure in the market.

Source: BCH/USD on TradingView
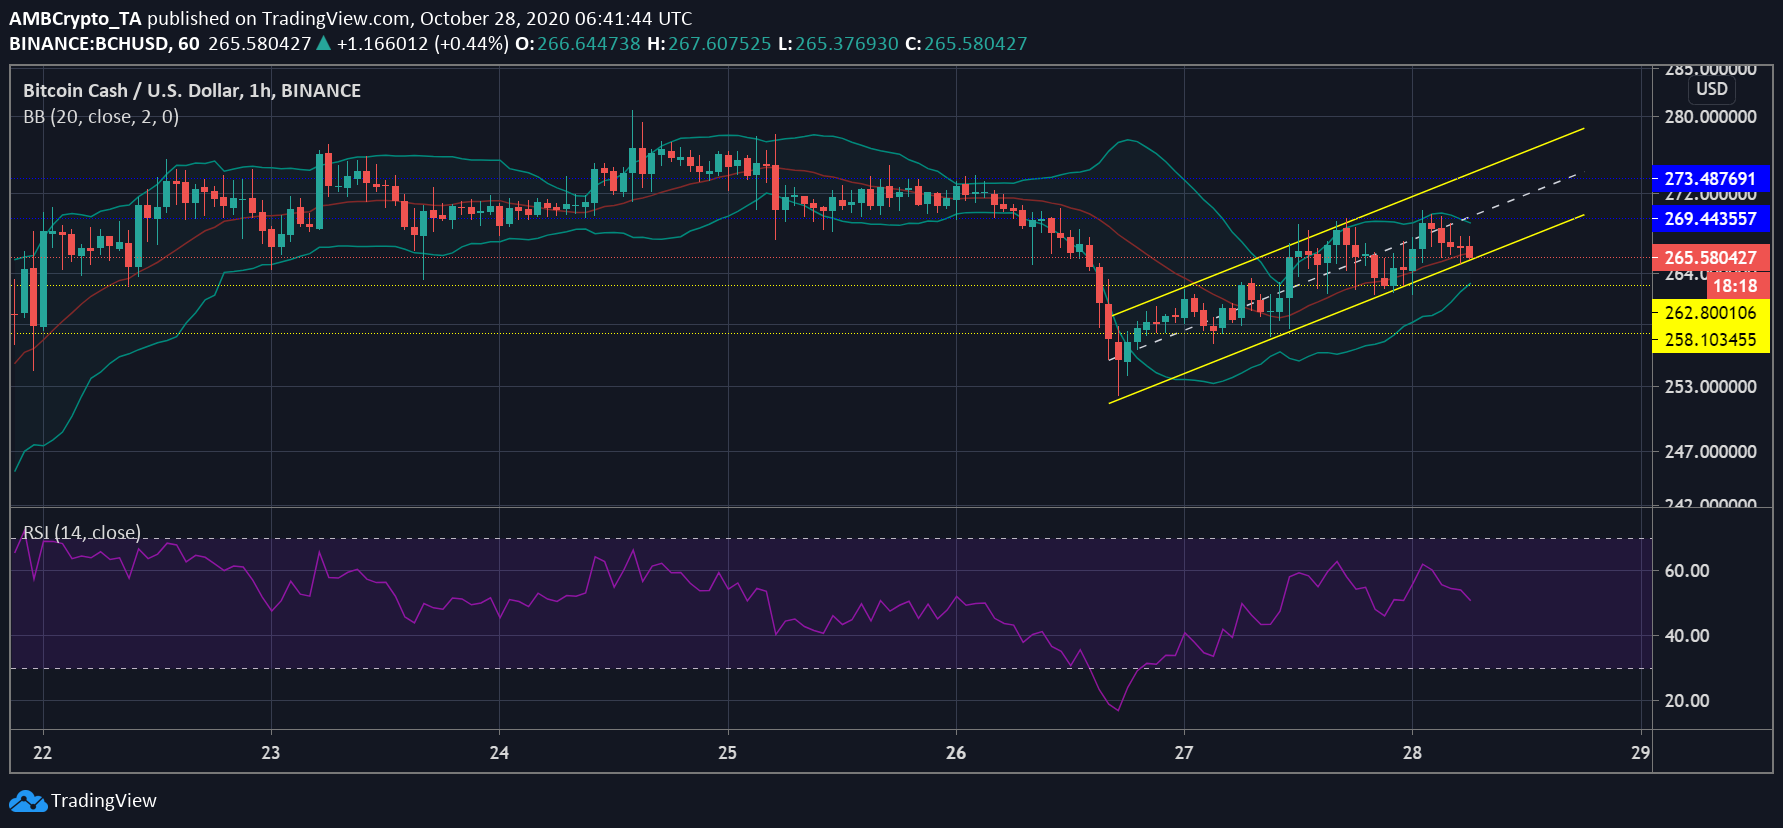
According to the hourly chart of BCH, the coin has had a parabolic journey in the recent past, as the price listed off from $240, peaked at $280, and then slumped. The coin has once again started increasing its value within an ascending channel but was met with strong resistance at $269. The value is dipping from this point and may result in a breakdown.
The support levels for this breakdown are visible at $262 and $258, but it may manage to reverse at $262. With low volatility in the market, a massive swing cannot be expected but the trend has been gaining bearish momentum, thus chances of a breakdown were increasing. Whereas the Relative Strength Index noted that the previous dip carried BCH to an oversold zone, and as the price has been building higher, it has moved to another extreme of being overbought.

Source: BCH/USD on TradingView
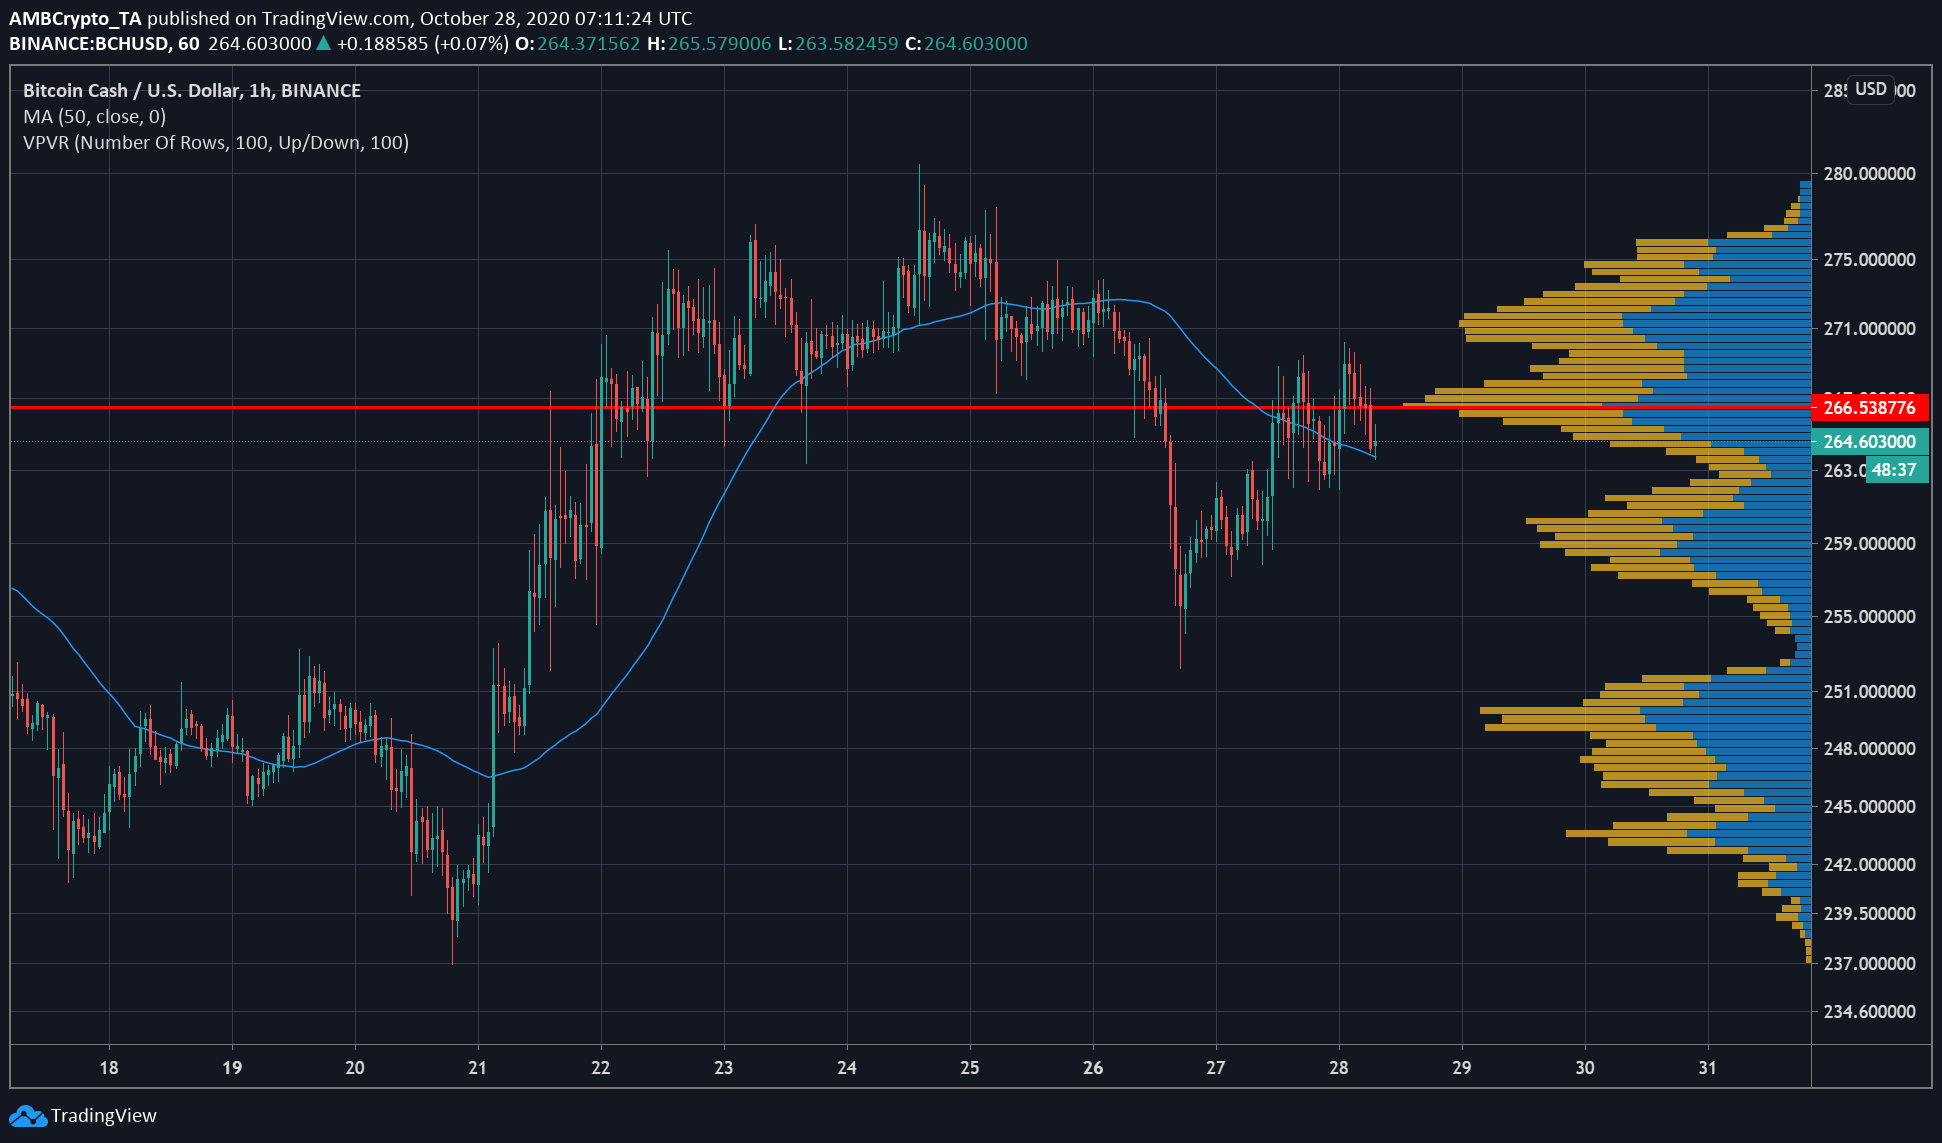
Although the 50 moving average rested under the candlesticks indicating a strong upward movement for the price. However, the price has dipped under the point of control at $266, which was acting as support for the asset. As suggested by the visible range indicator, there were not many high volume nodes under this point until $260. With price indicating a downward pressure, the upwards rally may have halted and overtaken by the bearish sentiment.
