Bitcoin Cash short-term Price Analysis: 2 December

Disclaimer: The findings of the following article are the sole opinion of the writer and should not be taken as investment advice
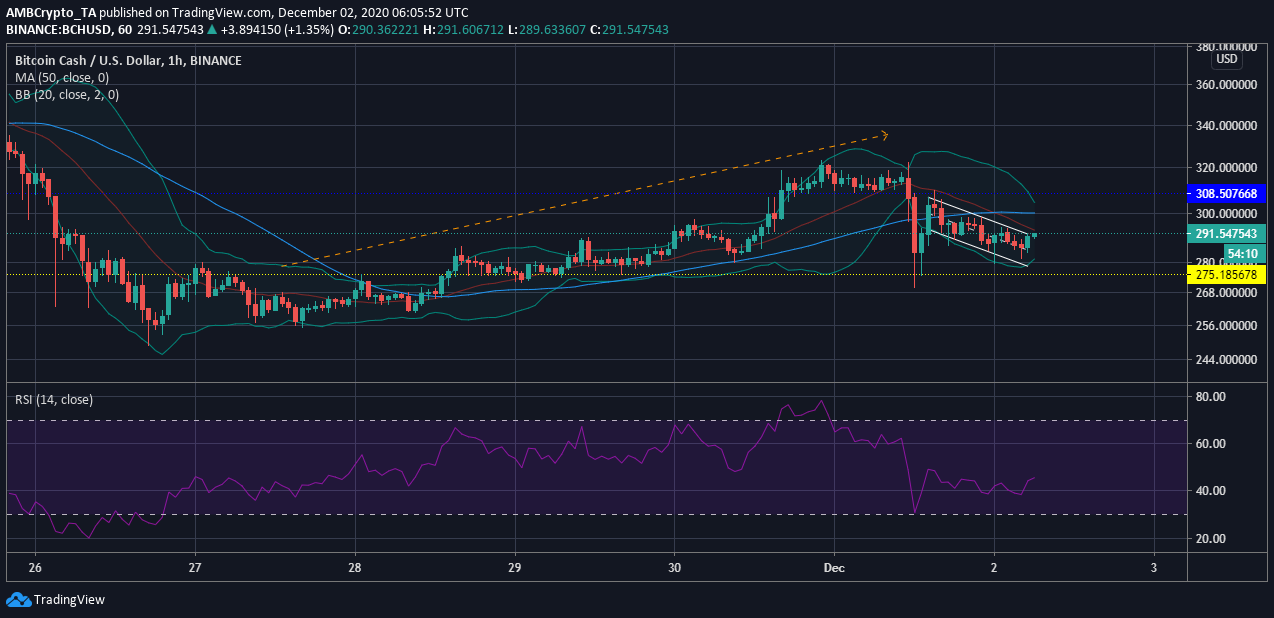
The value of Bitcoin Cash has been noting a sharp downtrend over the past couple of days. Given the drop witnessed in the Bitcoin market, even its hard fork has been following a similar trend. Although the coin tried to recover from the massive dump, its current price stood at $291.05, with a market cap of $5.40 billion.
Bitcoin Cash one-hour chart

Source: BCH/USD on TradingView
The above chart was indicating the price moving along a descending channel. the recent slump in price has witnessed a reversal in the bullish trend. At the time of writing, the BCH market had become bearish, while there was no particular direction for the price to head.
This meant short or long positions were difficult to achieve, at the given moment, whereas, the overall trend continued to be a bearish one.
Reasoning
The indecisiveness of the current trend could be due to the sudden volatility that hit the market yesterday. This volatility gave way to a bearish trend, but as we can see now, the volatility is retracing. The convergence of Bollinger Bands was indicative of this retraction, whereas, the signal line taking a position above the candlesticks noted falling asset value.
Whereas the Relative Strength Index touched the oversold zone when BCH fell till $269.99, however, pushed back up soon after. The RSI has been moving towards equilibrium, where the buying and the selling pressures were equal. At press time, the value for RSI was 45.65, which made it difficult to identify the upcoming trend in the market.
Conclusion
The current movement of Bitcoin Cash was showing low volatility and a level of indecisiveness in the upcoming trend. As the Bitcoin market recovers, we may see BCH recover too, however, in the short term, the coin may move more towards consolidation.
