Bitcoin Cash
Bitcoin Cash short-term Price Analysis: 16 September

Disclaimer: The following article attempts to analyze the emerging patterns in the Bitcoin Cash short-term market and its impact on price.
Ever since the March crash, the value of Bitcoin Cash had been restricted between $206.37 and $263.30, with sudden spurts and a correction adding to the trend. BCH was valued at $333 in mid-August after which its value began to shed and a final blow to the price in early September caused the price to shrink to $231.44, at press time.
Bitcoin Cash has tested its immediate support at $227.60 and has been able to bounce back. However, the market has not picked a trend yet in the short-term.

Source: BCH/USD on TradingView
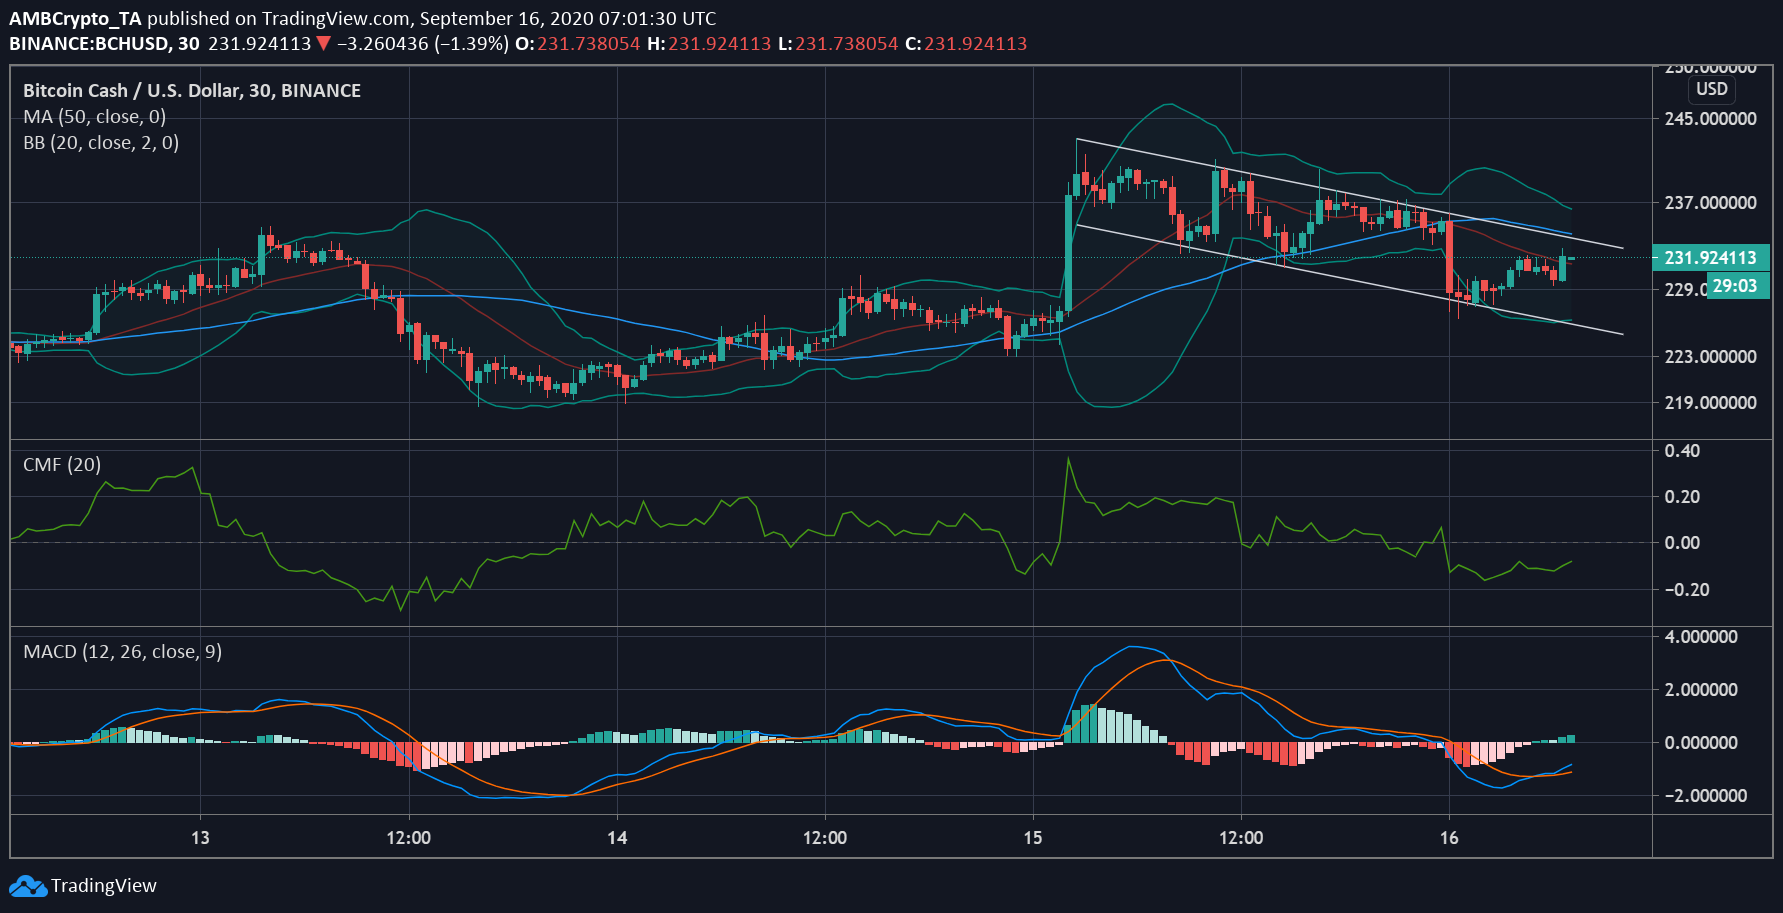
According to the chart above, BCH’s price was sloping downwards with an indication of great volatility. Even though volatility is not bad for the crypto market, it may cause a sudden price swing. The direction of the price swing might be downward, as the 50 Moving average still took a dominant position over the price. Whereas, the signal line of the Bollinger Bands was indecisive.
The sellers were actively selling the digital assets as the value of Chaikin Money Flow remained under the 0 mark. Whereas, the MACD indicator was suggesting buying pressure was returning to the market, although the momentum was not as high, buyers were interested in buying BCH at the current price.
Source: BCH/USD on TradingView
As Bitcoin Cash prepares for a move, a breakout may result in the value of the asset facing some resistance at $233.41, however, $237 may prove to be a difficult resistance to surpass. BCH price had tested it before collapsing to $227. Although the support was strong at $230, the BCH price had another strong support at $227.
As volatility makes its way to the market, the trend may lean towards bulls and BCH may witness an upward push to the price.
