
Disclaimer: The conclusions of the following analysis are foreseeable until the last week of June
Bitcoin Cash has been on a path to recovery since March. In fact, while most of the market fell on Black Thursday, BCH’s price had begun to fall well before that. While Bitcoin Cash has managed to go past the 12 March price point during the course of its recovery run, the relief was temporary and the coin, in line with its previous history, retraced.
At press time, Bitcoin Cash was being traded at $253 and had a market cap of $4.6 billion. Over the past 24 hours, BCH’s price saw it gain by 1.7 percent, having registered a trading volume of $1.7 billion.
1-day chart
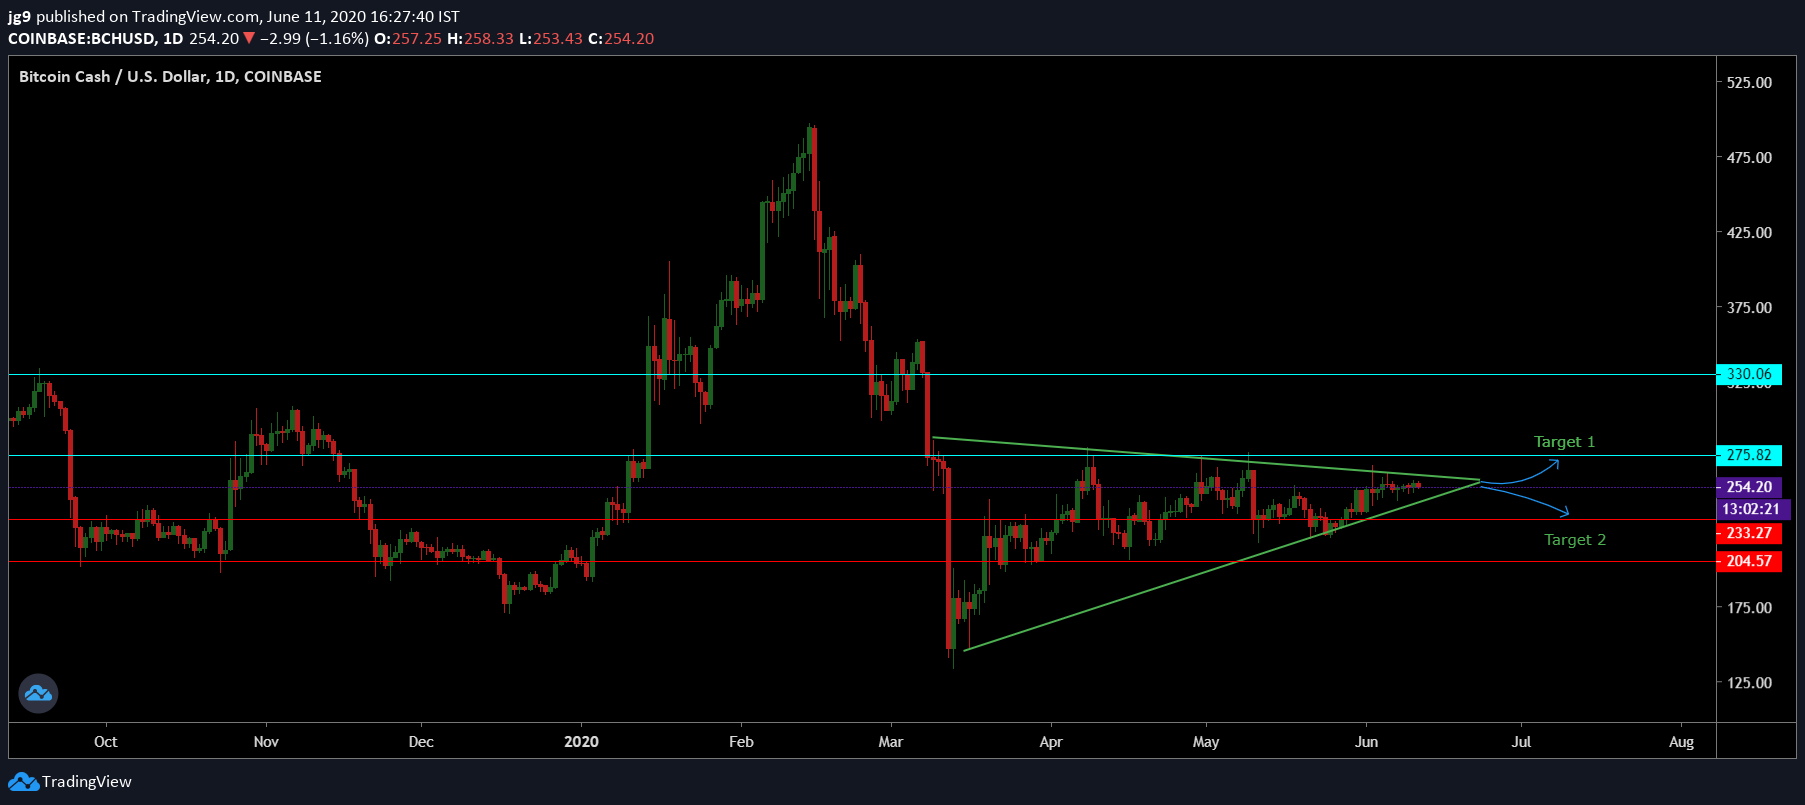
Source: BCH/USD, TradingView
According to the 1-day chart, Bitcoin Cash’s price has been in a symmetrical triangle formation for the past two months and is nearing a potential breakout. For BCH, if the price breaks out of the formation, the price may head in either direction. However, there is a slightly higher possibility of it moving towards its immediate resistance.
At the time of writing, for Bitcoin Cash, there were two crucial supports that have been tested in the past at the price points $233 and $204. The nearest resistance for the coin was $275, with the next major resistance quite some distance away at $330. When the price does break out of the formation, it will likely head towards Target 1 over the next few weeks.
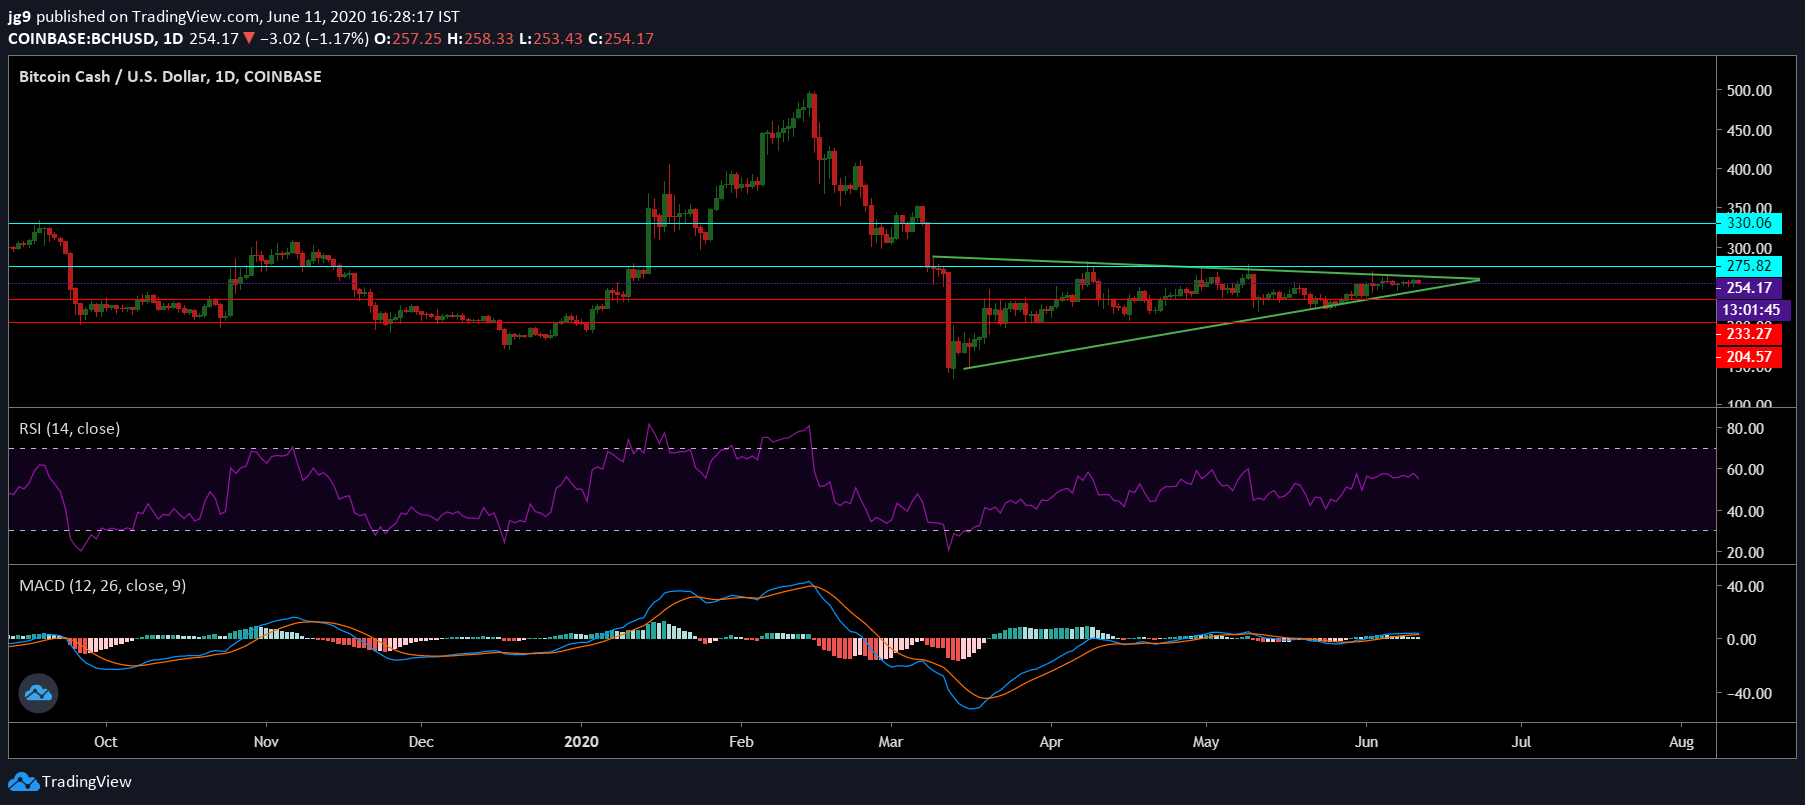
Source: BCH/USD, TradingView
According to BCH’s daily charts, the MACD indicator had undergone a bullish crossover, with the MACD line going past the signal line. Further, the RSI indicator was heading towards the neutral zone after having spent time in the overbought zone.
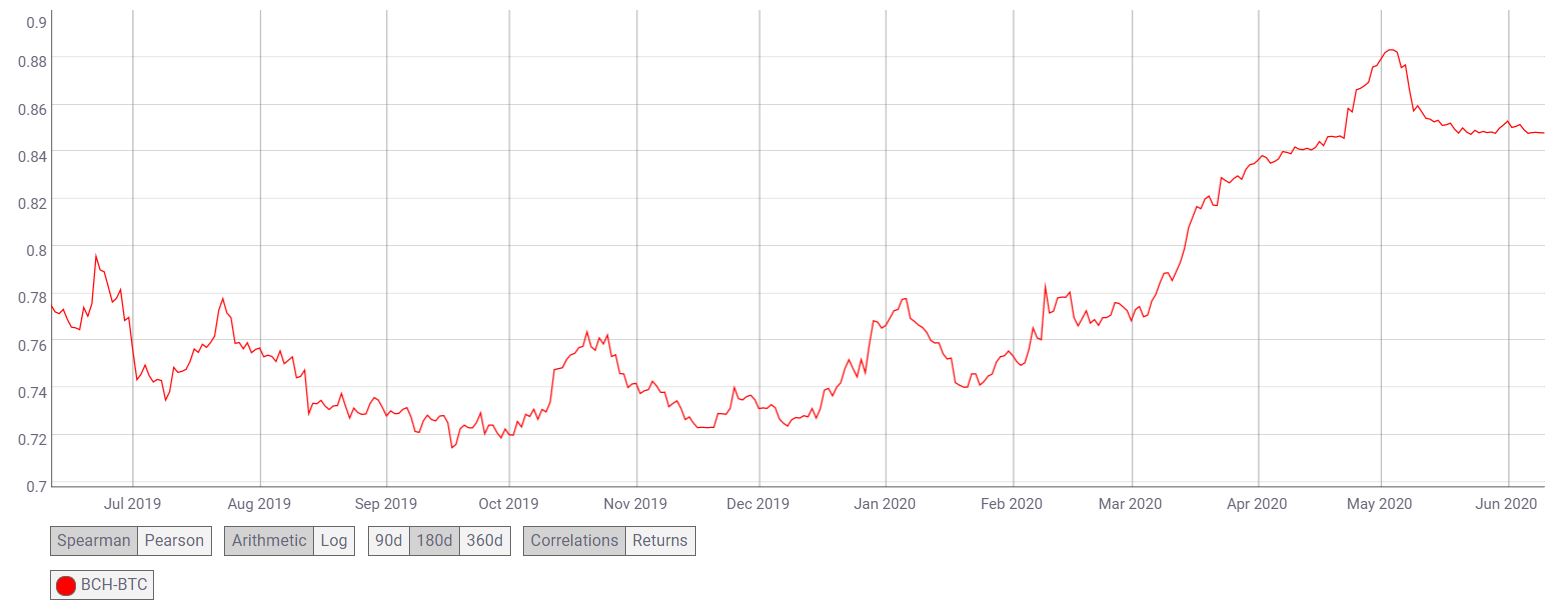
Source: CoinMetrics
Interestingly, Bitcoin Cash’s correlation with the world’s largest cryptocurrency, Bitcoin, continued to gain momentum and has been on a steady upward trajectory for a year now, with the correlation increasing from 0.77 to 0.84.
Conclusion
Bitcoin Cash has been in the symmetrical triangle formation for quite a while now and price breakout is likely to happen towards the end of June. Taking into account the indicators and the probable price breakout, BCH is likely to reach Target 1 – $275 towards the end of the first week of July. However, if the unlikely bearish scenario were to transpire, BCH may move towards Target 2 – $233 over the same time frame.