Analysis
Bitcoin Cash long-term Price Analysis: 10 October

Disclaimer: The findings of the following article attempt to analyze the emerging patterns in Bitcoin Cash’s long-term market and its impact on the price
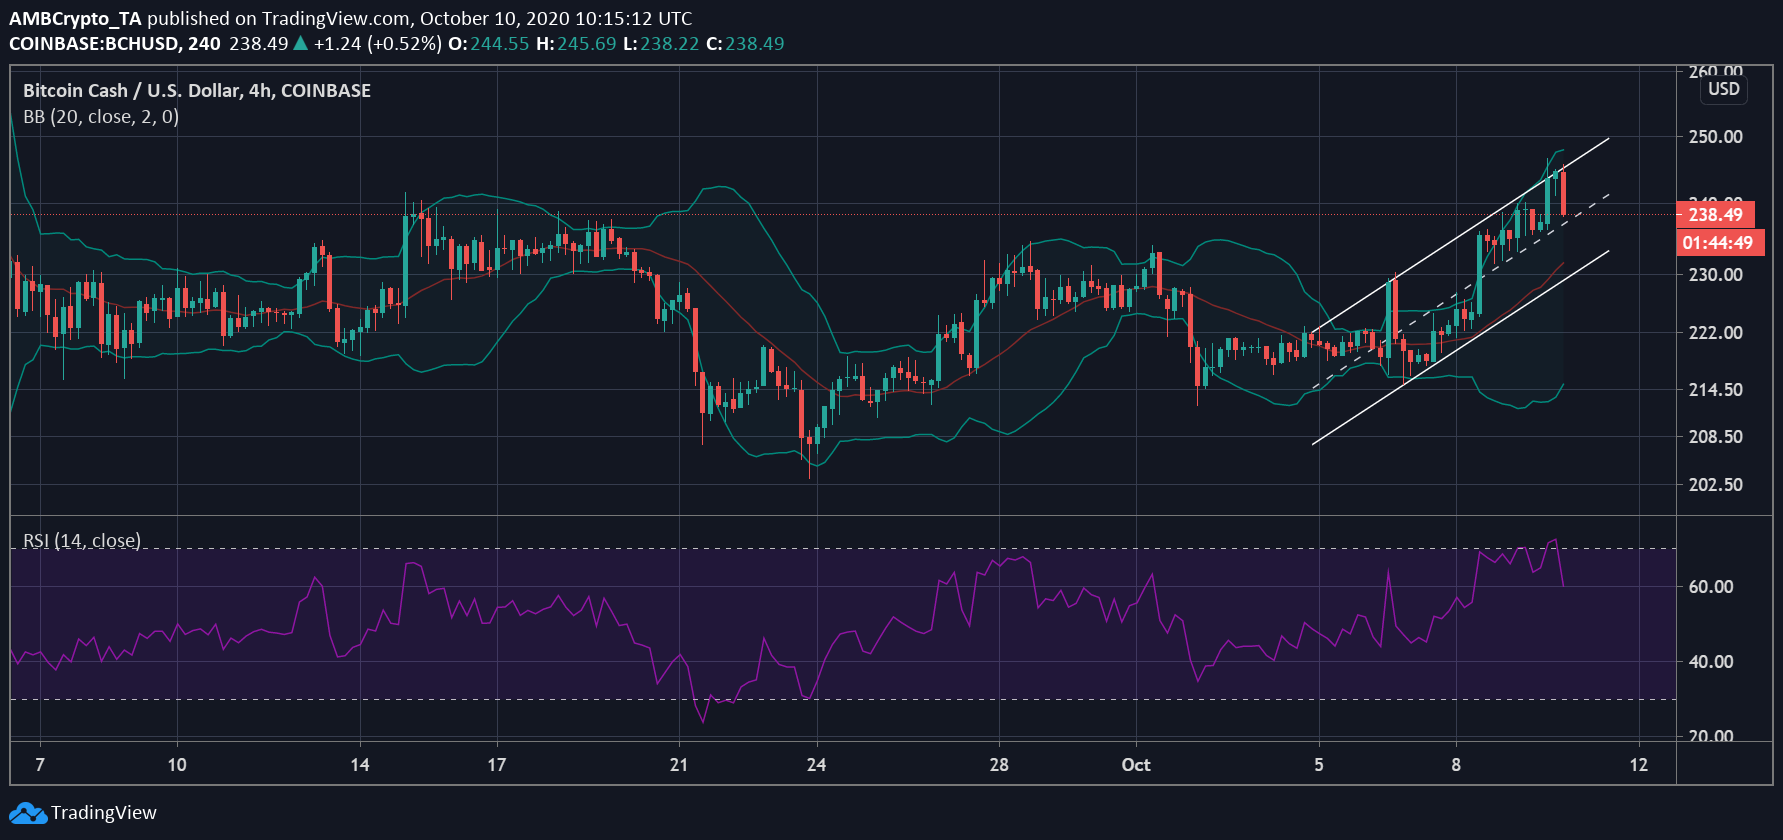
The Bitcoin market has been surging over the past couple of days and given the strong correlation between Bitcoin and its hard fork, Bitcoin Cash [BCH], the latter has noted a boost in its value too. In fact, BCH’s price climbed by 13.16% in the last 3 days. However, the crypto was soon dealing with a lot of selling pressure on the charts as its value slipped to $239.30 from $245 a few hours ago.

Source: BCH/USD on TradingView
The long-term chart for BCH highlighted the crypto’s rising price within the ascending channel formation. After the price recorded a strong push upwards earlier in October, the market opened itself to volatility, with the same remaining high since.
In fact, the Bollinger Bands haven’t diverged this much in a while and traders may witness yet another price swing soon. While BCH’s press time price was trying to form a higher high than its previous candles, there was a lot of selling pressure evolving.
However, at the time of writing, BCH remained on a bullish rally as even the position of the Signal line suggested that the price trend was moving up. Interestingly, the crypto-asset had just returned from the overbought zone and remained close to it. Further, the Relative Strength Index suggested that the buyers were bullishly buying BCH, but as the crypto-asset reached the overbought zone, there could be a trend reversal.
Source: BCH/USD on TradingView
Bitcoin Cash’s price had been trying to recover from the September fall for a while, but was consolidating for nearly a month between $234 and $221. However, after the cryptocurrency breached its resistance at $235, it has been moving closer to $246, a level that had not been tested recently. With bulls siding with the coin, BCH may find opportunities to re-test this level, before finally breaching it.
