- Bitcoin was moving towards the “Accessing Tops” indicator at press time
- Once the coin touches or rallies above this indicator, a decline can be expected to follow
The approval of a spot-based Bitcoin ETF by the US Securities and Exchange Commission (SEC) will likely result in a downward correction in Bitcoin’s [BTC] price, CryptoQuant analyst Binh Dang found in a new report.
Is your portfolio green? Check out the BTC Profit Calculator
Dang combined BTC’s Cumulative Value-Days Destroyed metric and its market price 50-day moving average to create an indicator called “Accessing Tops.” For the uninitiated, CVDD measures the coin’s activity and movement over time to identify market bottoms.
Dang noted that this indicator is used to identify potential market corrections. When the coin’s market price touches or exceeds this indicator, it is a sign that the market may be due for a pullback.
In the last month, BTC has witnessed a significant surge in its price. Exchanging hands at $34,296 at press time, the coin’s value has grown by 27% in the last thirty days, according to data from CoinMarketCap.
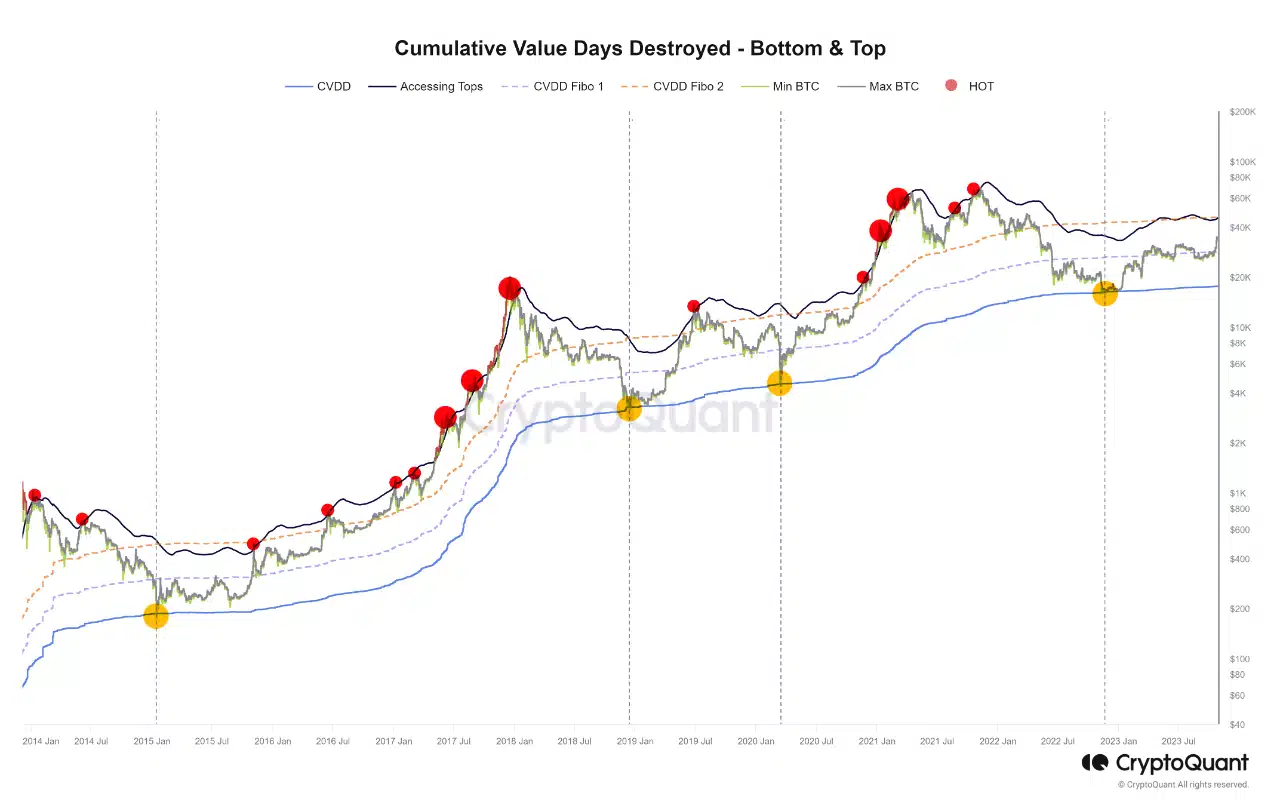
Source: CryptoQuant
Notably, BTC had started approaching the “Accessing Tops” indicator in the last few weeks.
According to Dang, the general market is currently optimistic due to the potential approval of Bitcoin’s spot-based ETFs. This has led investors to intensify their accumulation in anticipation of selling above their cost-basis.
Dang opined that such approval might cause BTC’s price to rally above the “Accessing Tops” indicator, at which point it would correct and trend downwards.
He stated:
“At least for now, with the momentum of the belief that there will soon be approved spot ETFs, and if there is not any bad news, gets only good news, the best further possible peak may occur when short-term investors decide to hold positions and continue to push BTC up to reach the indicator threshold.”
The decline might occur sooner than anticipated
An assessment of BTC’s price movements on a daily chart revealed that the coin’s price might witness a correction before the SEC’s spot ETF application approvals.
Readings observed from the Bollinger Bands indicator showed that BTC’s value remained severely volatile at press time.
In fact, the coin’s price traded close to the upper band of the indicator, suggesting that the market was overbought and that a pullback was imminent.
When the gap between the upper and lower bands of the Bollinger Bands is wide, it indicates that the price of the asset in question is moving away from the average.
Read Bitcoin’s [BTC] Price Prediction 2023-2024
Likewise, the coin’s Relative Strength Index (RSI) and Money Flow Index (MFI) confirmed the overbought nature of the BTC market. At press time, the coin’s RSI was 80.13, while its MFI was 83.89.
Buyer exhaustion and profit-taking are common at these levels; hence, caution is advised.
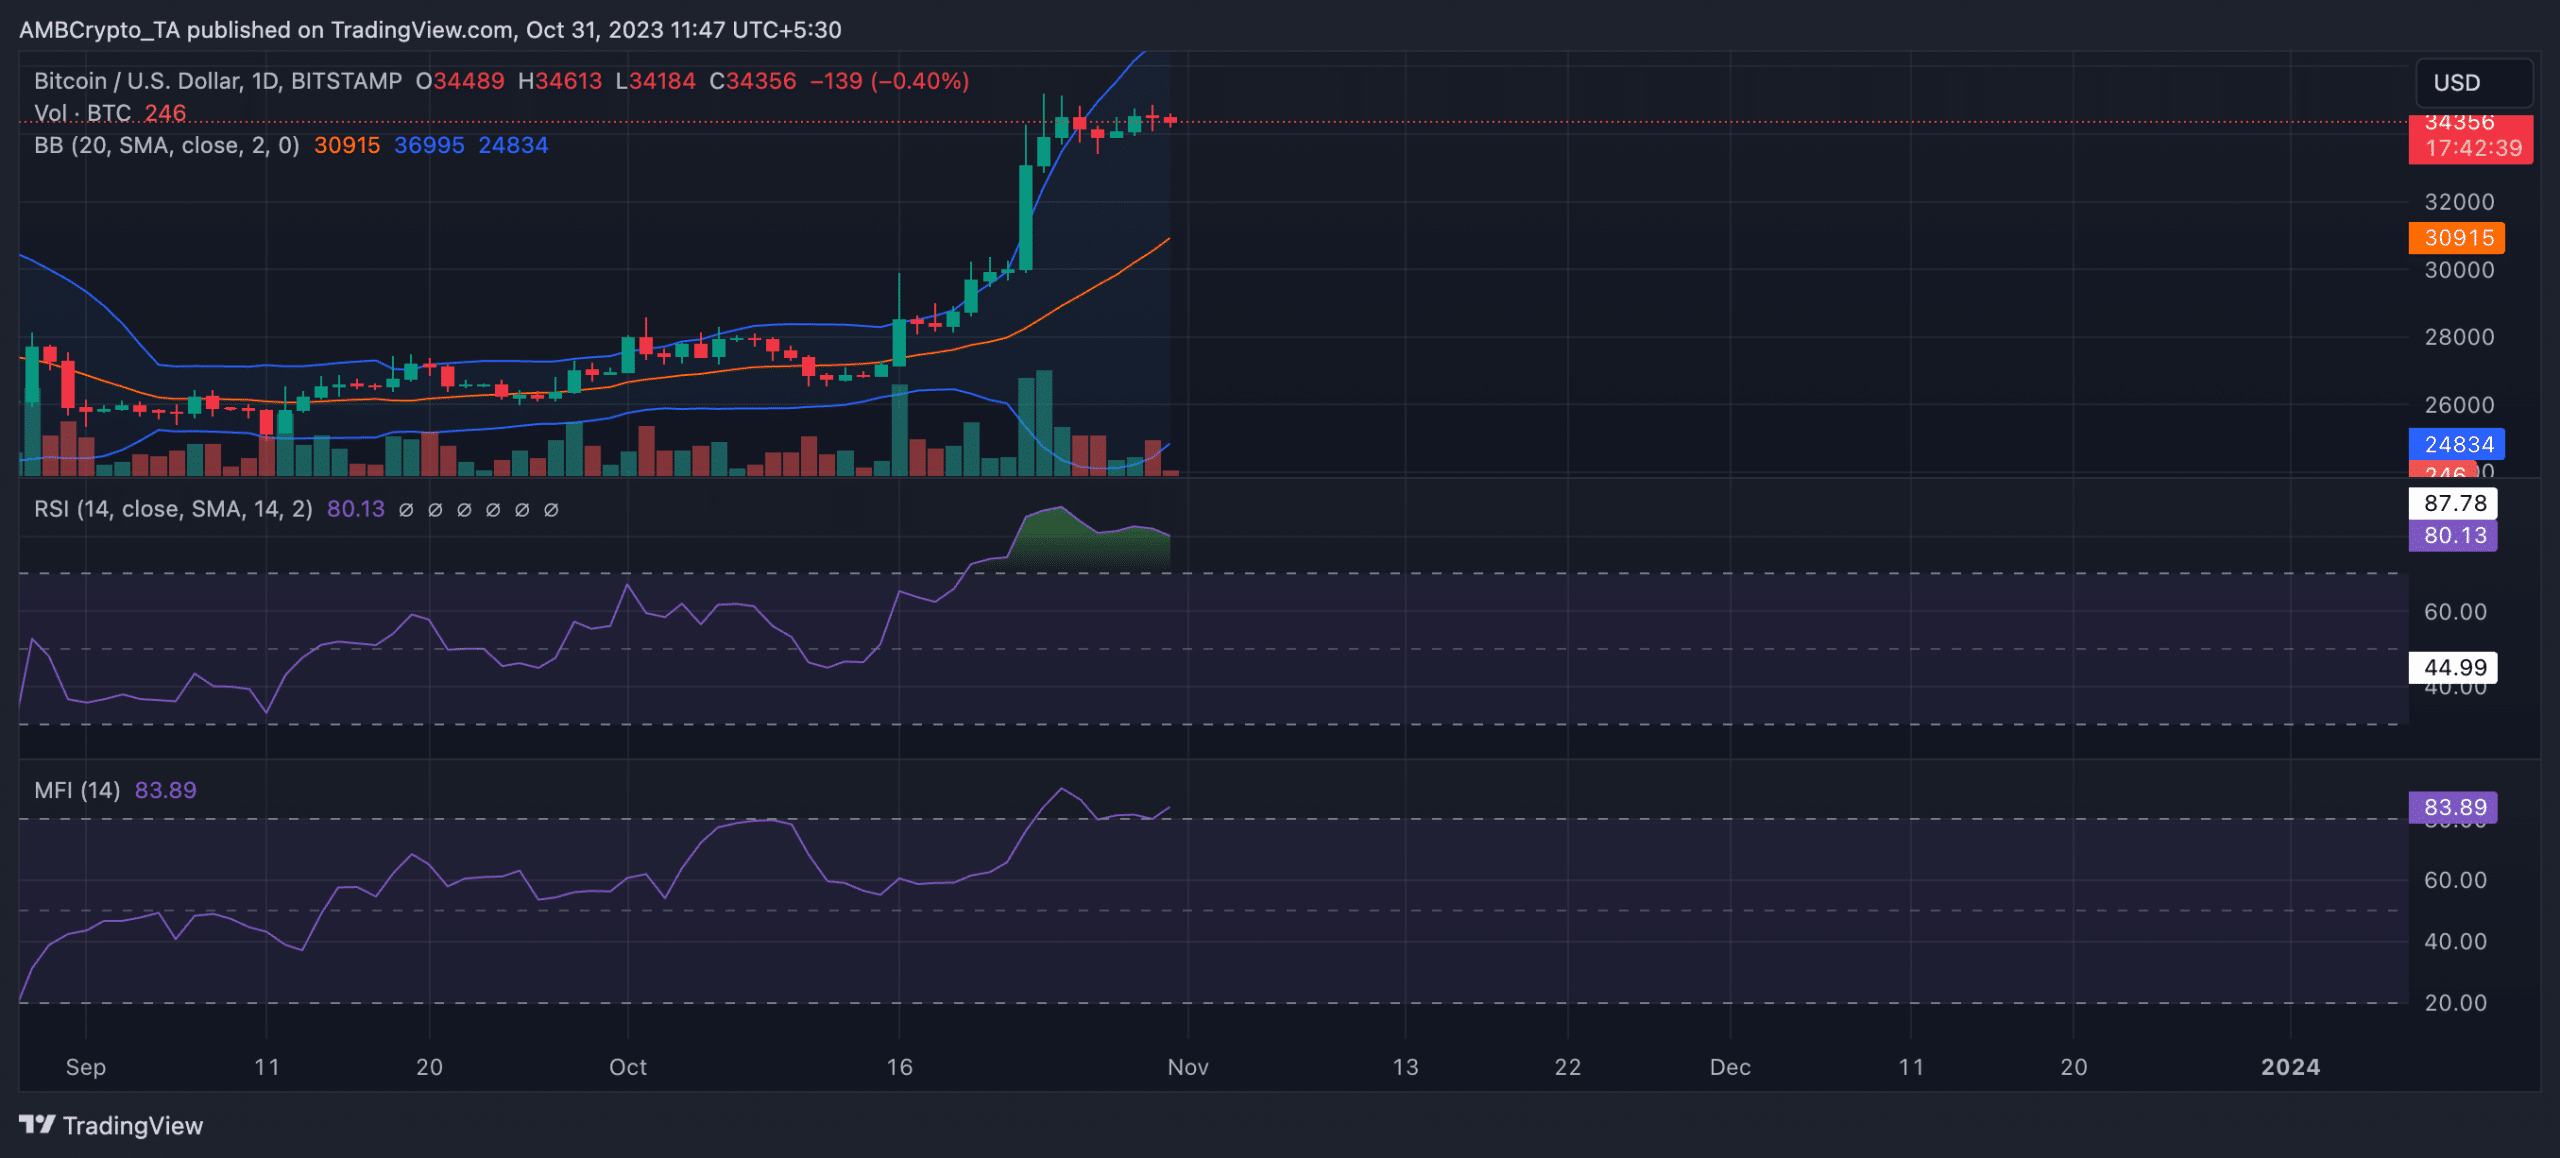
Source: BTC/USDT on TradingView