
- Despite the price hike, the market sentiment around BTC turned bearish
- If a price correction happens, BTC might plummet to $63k
Bitcoin’s [BTC] price once again gained bullish momentum as it continued to trade above $70k. However, things might turn bearish in the short term as the king of cryptos’ price was moving inside a parallel channel.
Therefore, let’s have a closer look at BTC’s state to see how it might end this week.
Bitcoin is inching towards $71k
According to CoinMarketCap, BTC’s price gained bullish momentum last week as it surged by over 6%. In fact, in the last 24 hours alone, BTC was up by over 2.4%.
Thanks to the uptrend, BTC sat comfortably above the $70k psychological support level. At the time of writing, BTC was trading at $70,768.46 with a market capitalization of over $1.39 trillion.
But investors should not start celebrating yet, as there are chances of a trend reversal.
Crypto Tony, a popular crypto analyst, recently posted a tweet highlighting that BTC’s price was moving inside a parallel channel. If that’s true, then BTC would soon witness a price correction before it initiated another bull rally.
As per the tweet, the upcoming price correction might push the coin’s price down towards the $63k mark.
Investor sentiment around BTC had already turned bearish. Our analysis of Santiment’s data revealed that after a sharp spike, BTC’s weighted sentiment went into the negative zone.
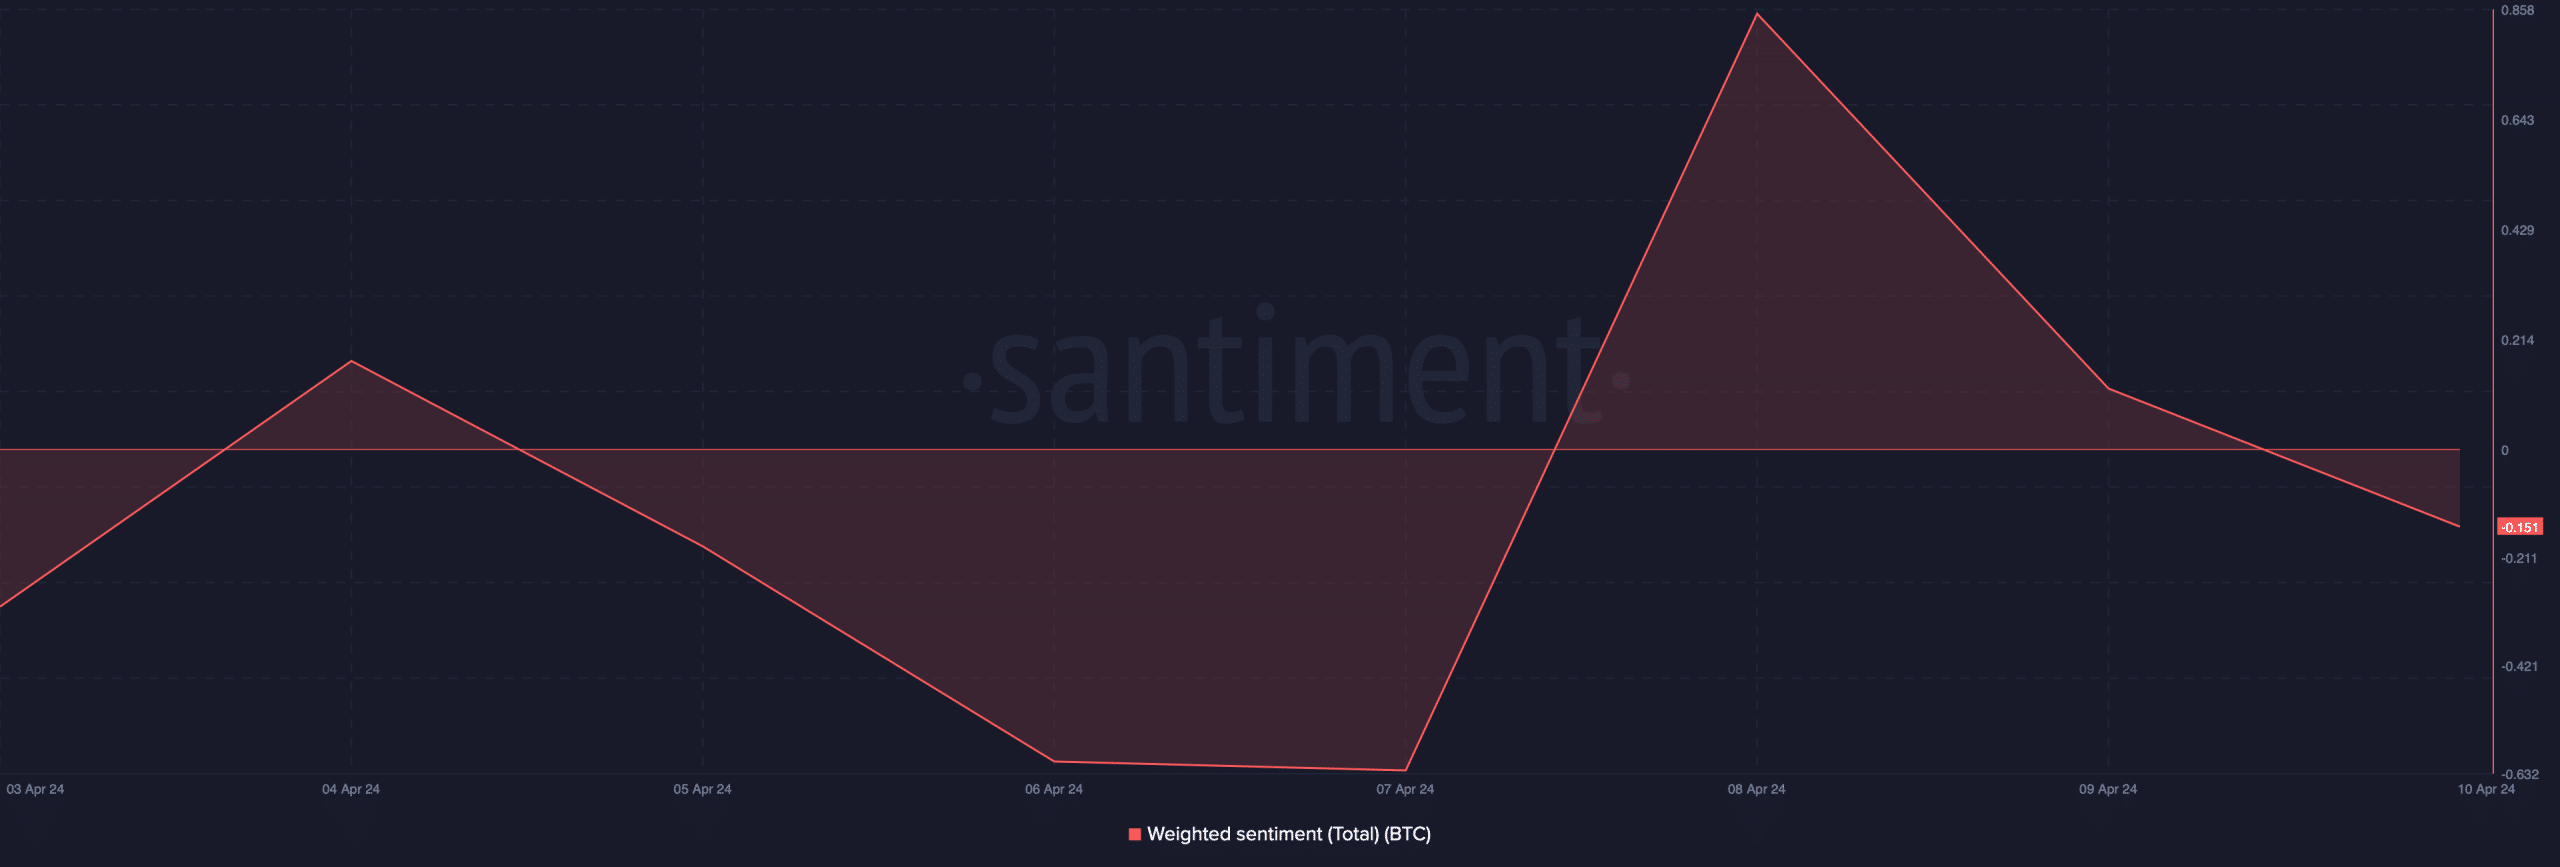
Source: Santiment
What metrics suggest
To see how viable it is for BTC to turn bearish again, AMBCrypto took a look at its on-chain metrics. As per our analysis of CryptoQuant’s data, Bitcoin’s aSORP was red, meaning that more investors were selling at a profit.
In the middle of a bull market, it can indicate a market top.
Another bearish metric was the NULP, as it indicated that investors were in a belief phase where they were in a state of high unrealized profits.
Selling pressure on BTC was also increasing, as its net deposits on exchanges were high compared to the last seven-day average.

Source: CryptoQuant
Read Bitcoin’s [BTC] Price Prediction 2024-25
AMBCrypto then analyzed BTC’s daily chart to better understand which way it was headed. The coin’s Money Flow Index (MFI) registered a downtick, indicating that the chances of a price correction were high.
Nonetheless, the MACD displayed a bullish crossover. Moreover, the Chaikin Money Flow (CMF) also supported the bulls as it moved northwards.
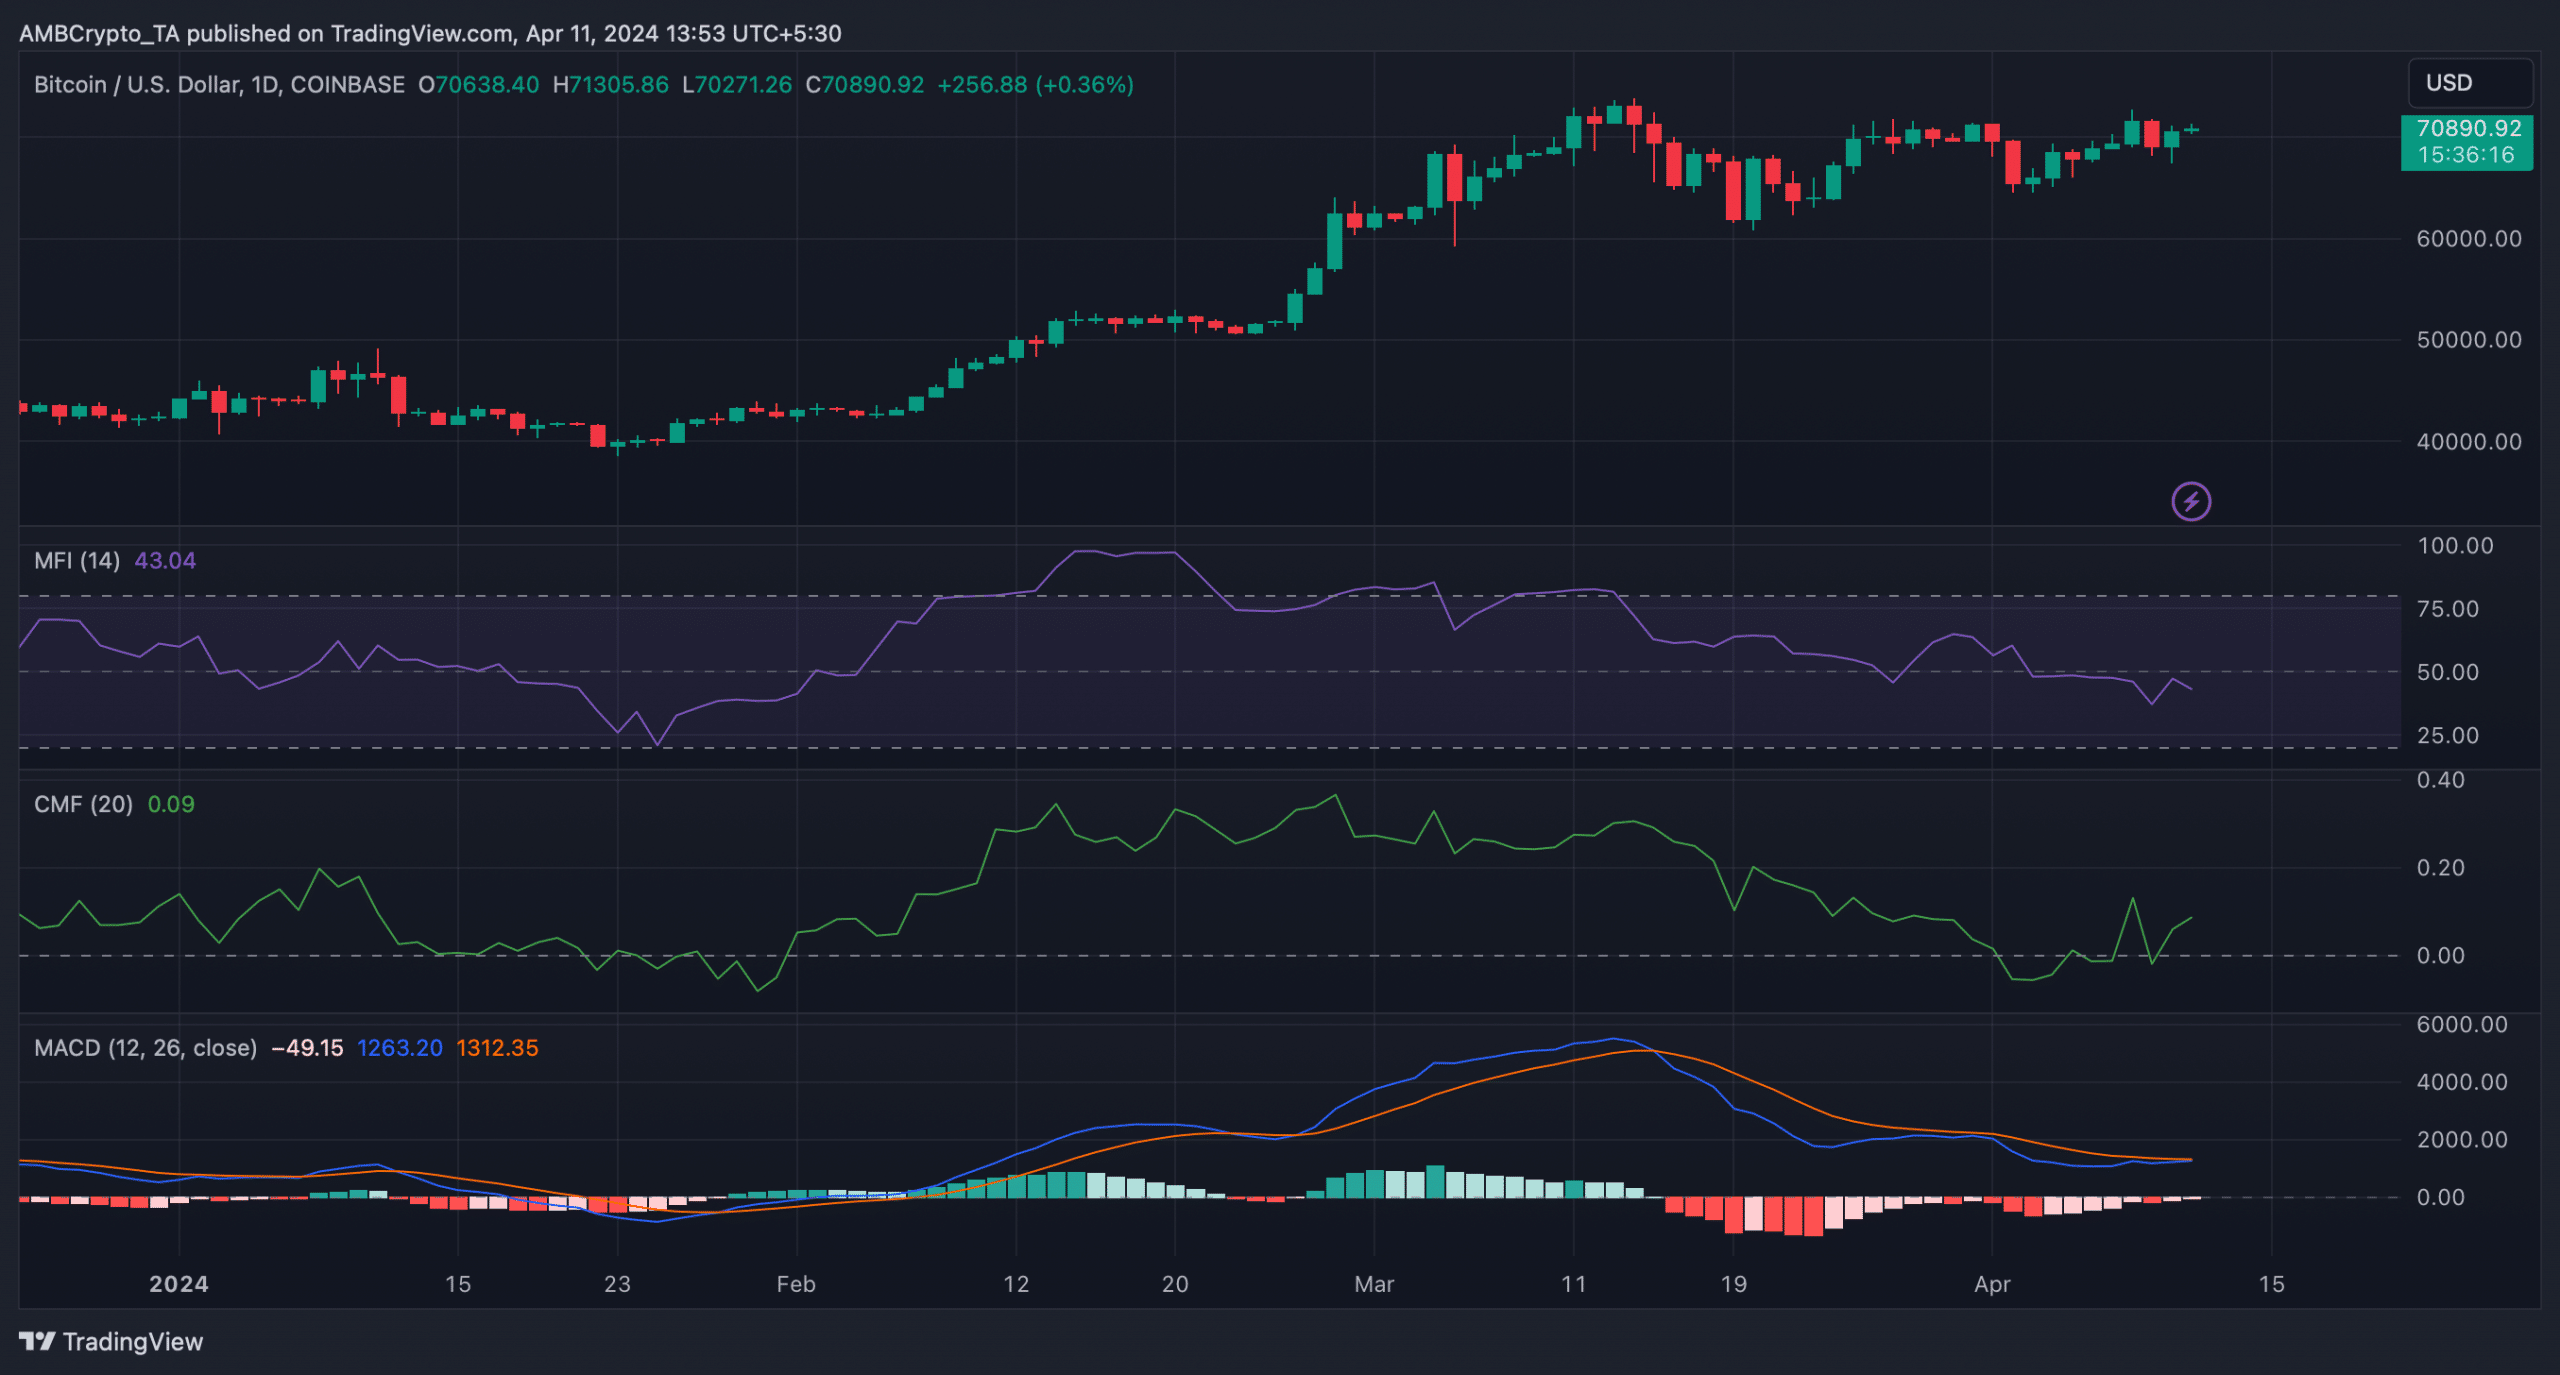
Source: TradingView