- BTC was up by more than 15% in the last seven days.
- Buying pressure on the coin was high, but its RSI and CMF suggested a trend reversal.
Over the last few days, Bitcoin [BTC] has come a long way as it surpassed the $43,000 mark. As reported earlier by AMBCrypto, crossing the $42,500 mark was a task for the king of cryptos, which it has completed successfully.
Therefore, should investors now expect BTC to rise above $50,000 anytime soon?
Bitcoin crosses a key level
As reported by AMBCrypto, BTC’s liquidation increased near the $42,500 mark in the recent past. Because of this, it was important for the coin to go above that level in order to reach a new high. Thankfully, Bitcoin managed to overcome that barrier.
According to CoinMarketCap, BTC was up by more than 15% in the last seven days.
At the time of writing, it was trading at $43,990.87 with a market capitalization of over $860 billion. The possibility of BTC reaching $50,000 seems high based on its price trend.
In fact, Ali, a popular crypto analyst, recently posted a tweet highlighting a bullish indicator. As per his tweet, BTC’s realized price was surpassing the long-term Holder price.
Typically, this means that the market is gaining momentum, with newer investors willing to buy at higher prices.
Just in case you need another bullish confirmation signal!#Bitcoin Realized Price is now surpassing the Long-Term Holder Realized Price, indicating that the #crypto market is gaining momentum, with newer investors willing to buy at higher prices.
This can be seen as a… pic.twitter.com/emeUZzkS5l
— Ali (@ali_charts) December 6, 2023
He added that,
“This can be seen as a bullish sign, showing confidence in BTC’s future performance. The last three times this happened, BTC skyrocketed 12,736%, 4,474%, and 819%, respectively.”
A closer look at Bitcoin’s state
AMBCrypto then took a look at Bitcoin’s on-chain metrics to determine whether the possibility of BTC touching $50,000 was likely.
Our analysis found that BTC’s exchange reserve was dropping, meaning that buying pressure on the coin was high.
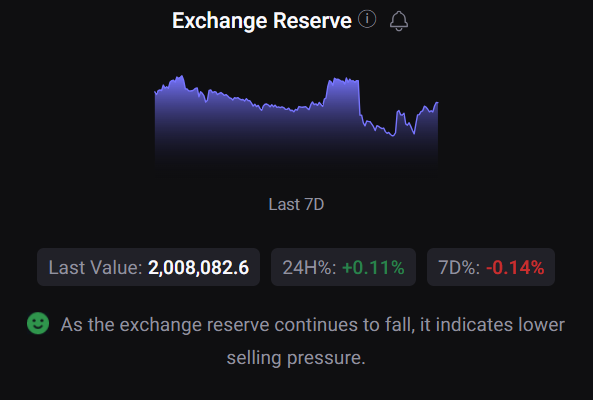
Source: CryptoQuant
Buying sentiment among US investors was also high as its Coinbase premium was green.
Additionally, things in the derivatives market looked optimistic as well. BTC’s funding rate was high, suggesting that futures investors were actively buying BTC at its higher price.
The fact that buying sentiment in the derivatives market was high was also proven by its taker-buy-sell ratio, which was green.
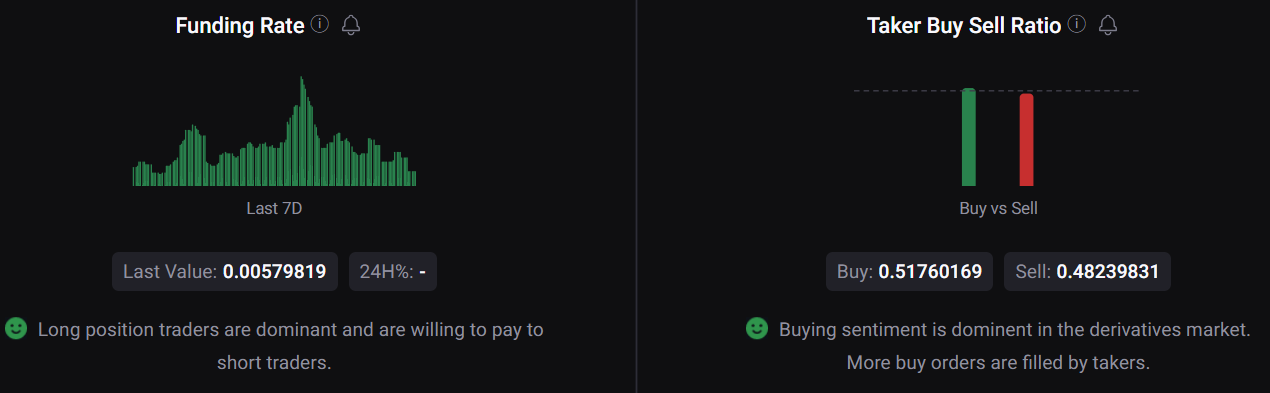
Source: CryptoQuant
Read Bitcoin’s [BTC] Price Prediction 2023-24
Though the aforementioned metrics look optimistic, BTC’s daily chart revealed a different story. As per AMBCrypto’s analysis, BTC’s Relative Strength Index (RSI) was in the overbought zone, which can increase selling pressure.
Its Chaikin Money Flow (CMF) also registered a downtick, increasing the chances of a price correction in the days to follow.
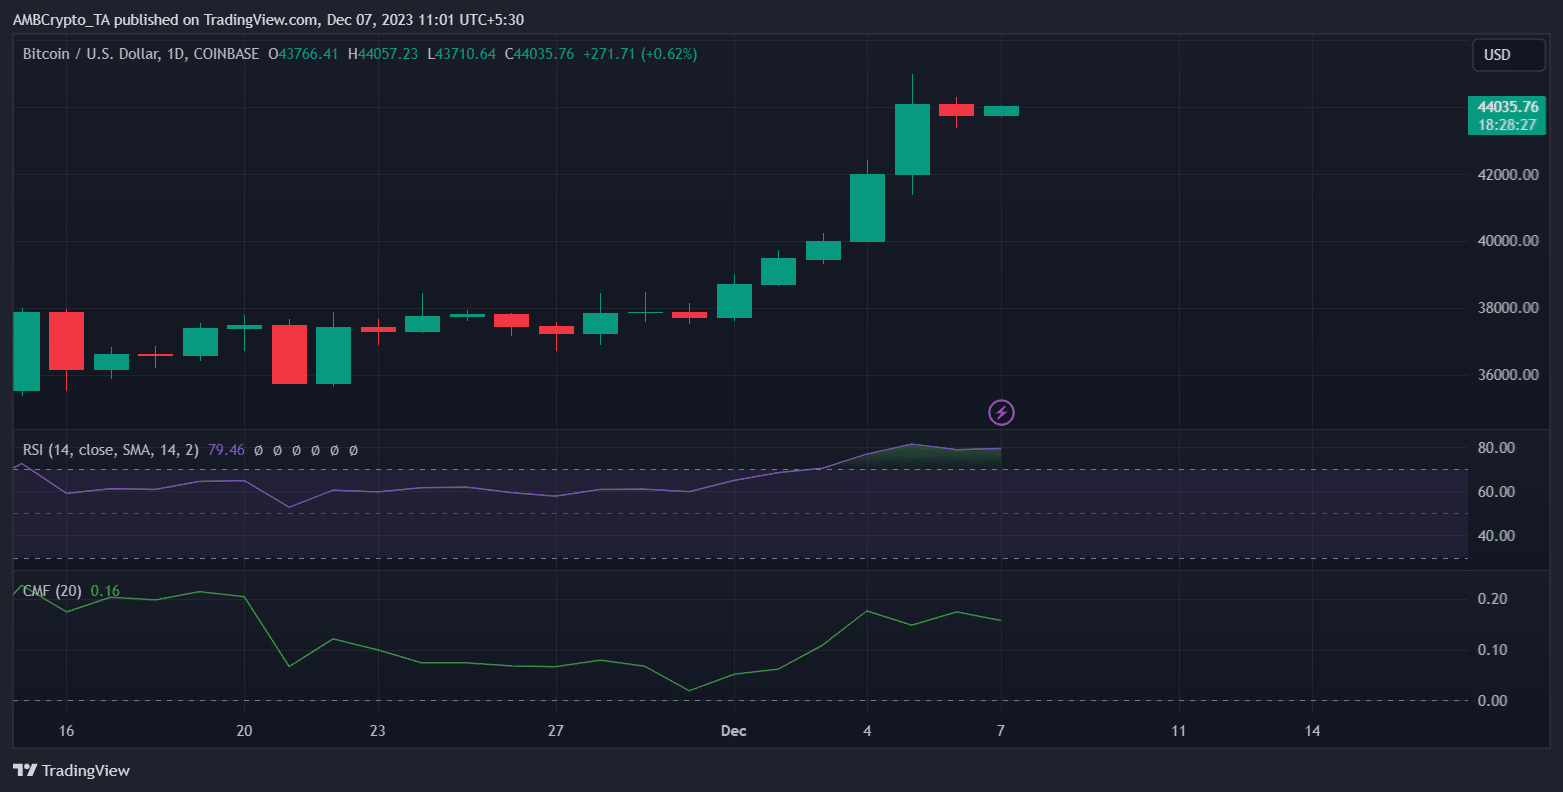
Source: TradingView