Crypto News
Binance Coin, Dash, Dogecoin Price Analysis: 1 September
Binance Coin advanced steadily toward resistance after stepping out of a range it traded within for a few weeks. Dash showed bearish signals and could test support and even drop beneath support while Dogecoin continued to sustain the bearish sentiment.
Binance Coin [BNB]

Source: BNB/USDT on TradingView
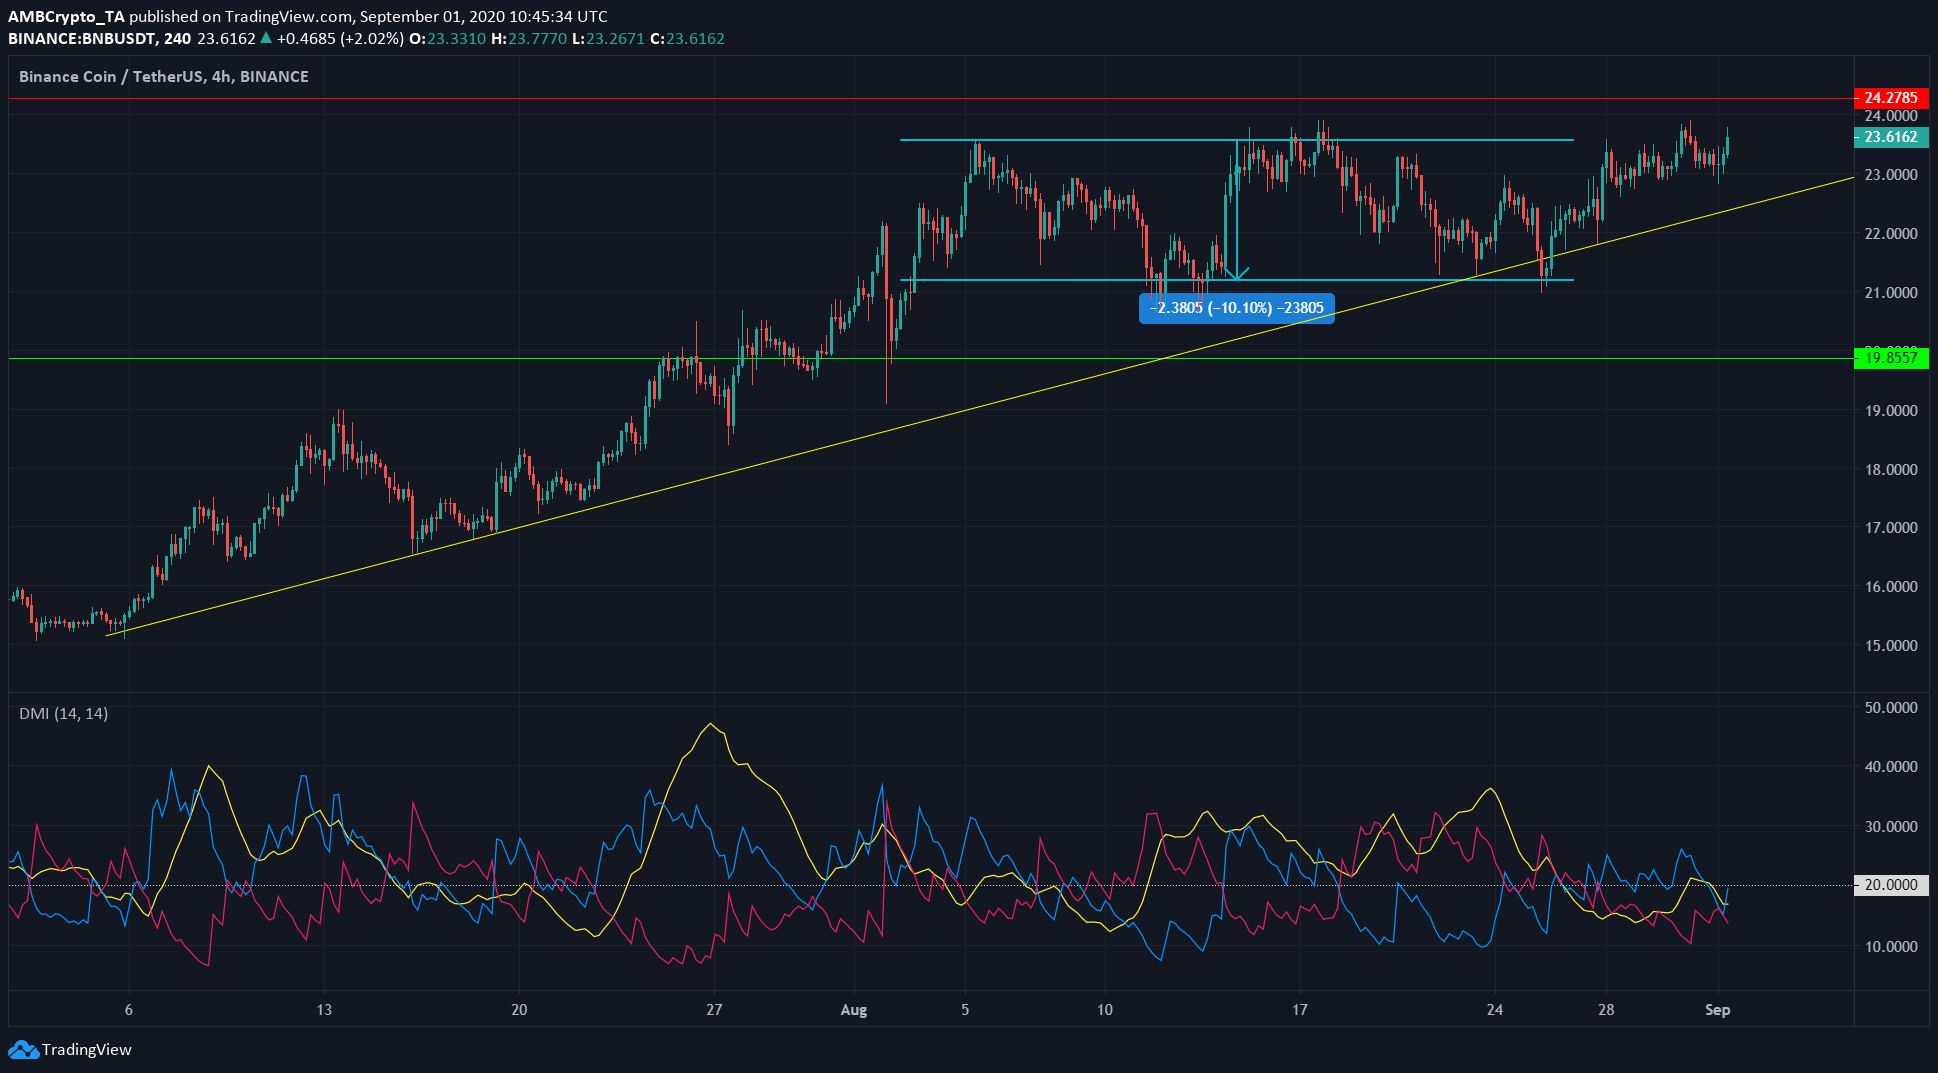
BNB appeared to trade within a range for the greater part of August. However, it could now break out of that price rand but the opposite is also possible at the moment.
Directional Movement Index showed a lack of strong trend in the BNB market, with the ADX (yellow) beneath 20 line that many traders use to separate a strong trend from weak ones.
One thing to note is, BNB has been in an uptrend since early July (yellow trendline). So long as the price did not dip beneath this trendline, it is possible BNB moves upward to flip the resistance at $24.3 zone to support.
Dash [DASH]
Source: DASH/USDT on TradingView
DASH was trading at $88.39 at press time. Support for DASH is at $84 zone. Considering the bearish nature of the coin for the past couple weeks, it is likely DASH could retest support.
As of press time, DASH did not signal it had broken outside a downtrend. At best it could consolidate above its support, unless buying pressure stepped in during the course of the next few days.
RSI showed 57, which is bullish. It does not necessarily mean DASH had reversed the downtrend.
50 EMA (yellow)and 100 EMA (pink) still act as resistance for the asset, with Parabolic SAR also giving a sell signal. The dots were very close to the price, indicating that the signal may change over the next few sessions. DASH is more likely to drop or consolidate than see a price rise in the short-term.
Dogecoin [DOGE]
Source: DOGE/USDT on TradingView
Dogecoin is the internet’s favorite meme-coin, but traders and investors of the coin do not seem to share the same positive sentiment toward the asset. DOGE price dropped beneath 200 EMA (purple), while 100 EMA (pink) was etched atop the 200 EMA, and threatened to go further to confirm bearishness.
Bollinger bands indicated decreased volatility. This was contrasted by the 24h trading volume of DOGE, which stood at $85 million, a value higher than the daily average for most of August.

