
Binance Coin’s technical indicators hinted towards an incoming selling sentiment, with BNB seemingly primed for a downward price action on its charts.
Further down the crypto-ladder, Cosmos and Dash too were likely to register a downtrend, despite the cryptocurrencies recording some daily gains, as technical indicators suggested a trend reversal to bearish in the short-term period.
Binance Coin [BNB]
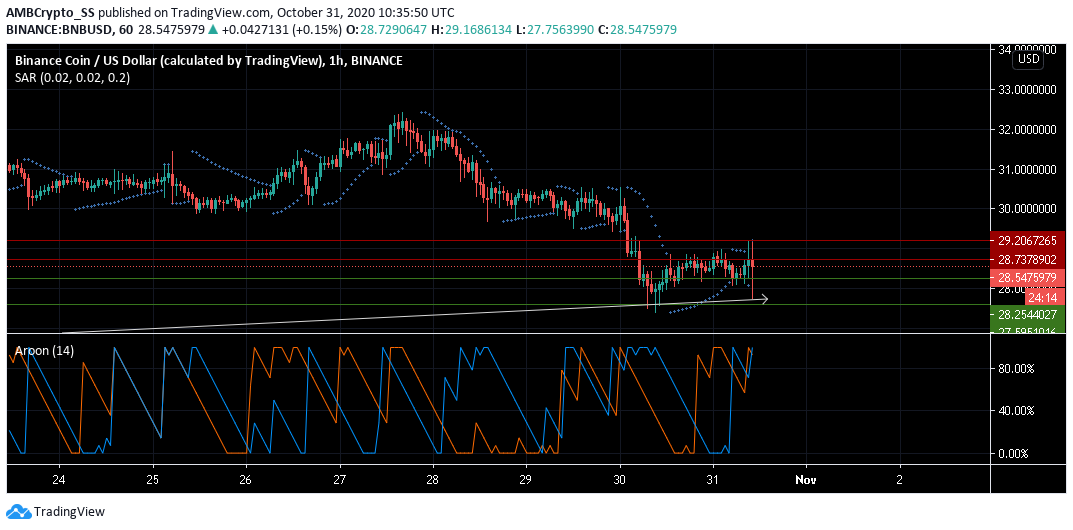
Source: BNB/USD on TradingView
The Aroon Indicator for Binance Coin was slightly bearish as the Aroon Down (blue) had started to cross above the Aroon Up (orange). However, the aforementioned bearish strength was still too weak to initiate a major sell-off.
At press time, BNB’s price was seen alongside its immediate support level at $28.254, following a bounce above the previous support at $27.595
While the overall trend for BNB remains positive, southbound price action seemed imminent, with the same underlined by the Parabolic SAR’s dotted lines being found above the price candles.
Cosmos [ATOM]
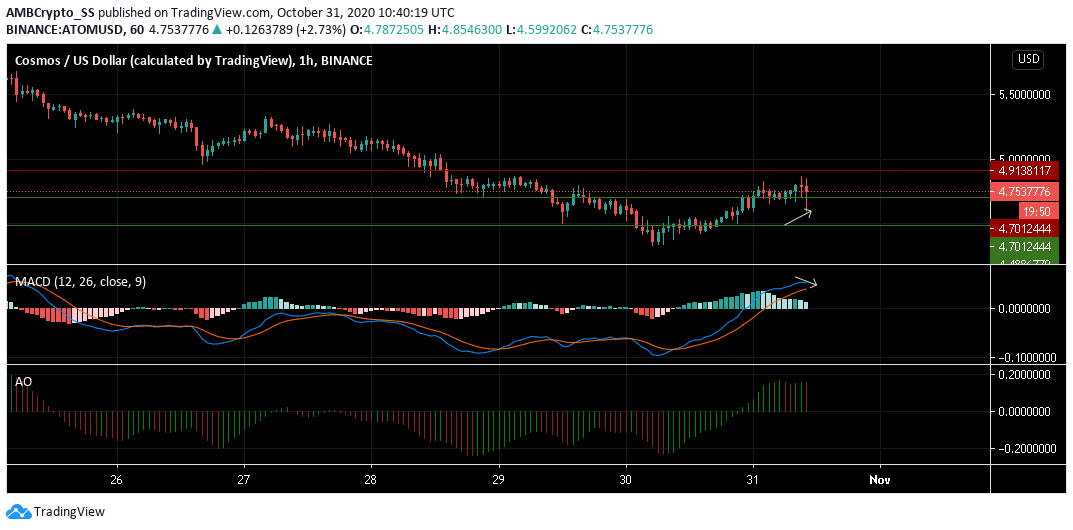
Source: ATOM/USD on TradingView
Despite rallying from the $4.40 support level and towards the $4.75 mark since yesterday, Cosmos failed to sustain its upward price momentum.
Facing downward pressure from its immediate resistance level, the digital asset could turn south in its upcoming trading sessions.
A bearish MACD divergence was visible on the trading chart for Cosmos as the price made higher highs and MACD indicator displayed lower highs.
The Awesome oscillator too signaled short-term bearishness with red closing bars above the zero line.
DASH
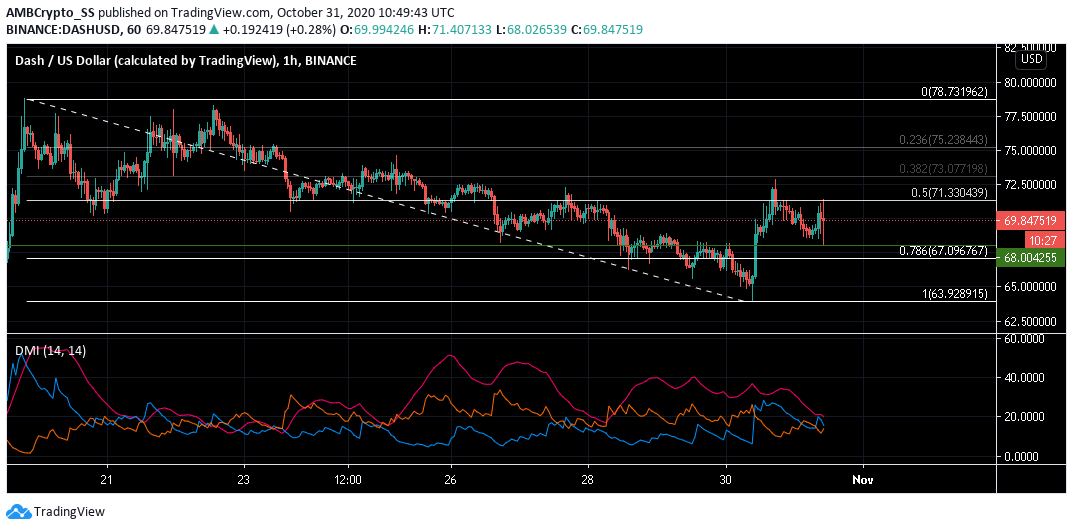
Source: DASH/USD on TradingView
At the time of writing, early signs of a bearish trend for DASH were picked up by its Directional Movement Index.
The -DMI (orange) was starting to rise towards the +DMI (blue) which had already turned south. Further, the ADX (pink) was also showing weakness in the existing upward price trend.
The digital asset also faced stiff resistance below the 50% retracement region marked by the Fibonacci retracement tool, which pushed down the prices for DASH towards the $68.004 support level at press time.
Despite the 1.5% gains since yesterday, a selling sentiment was identified from the digital asset’s technical indicators for the short to medium term period.