Assessing where Bitcoin’s cycle top lies – Is $160K on the cards?

- The greedy sentiment prevalent in the market despite the recent pullback was not a cause for concern
- The Bitcoin Price Temperature showed that the price of BTC is likely to push beyond $160k
Bitcoin [BTC] was trading at $95.1k at press time. On the 7th of January, it fell 5.2% from $102.2k to $96.9k. This happened on the back of “better-than-expected” U.S. Economic Report.

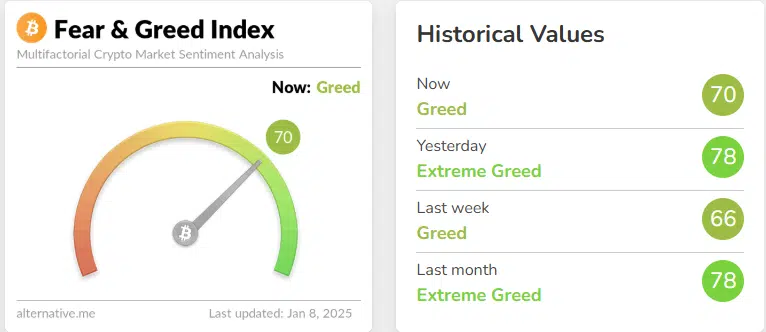
Source: Alternative.me
A look at the crypto fear and greed index showed that the market sentiment was still greedy. With BTC struggling to reclaim the $100k level, was this an early warning that investors should sell and exit the market?
Using indicators and metrics to time the Bitcoin top
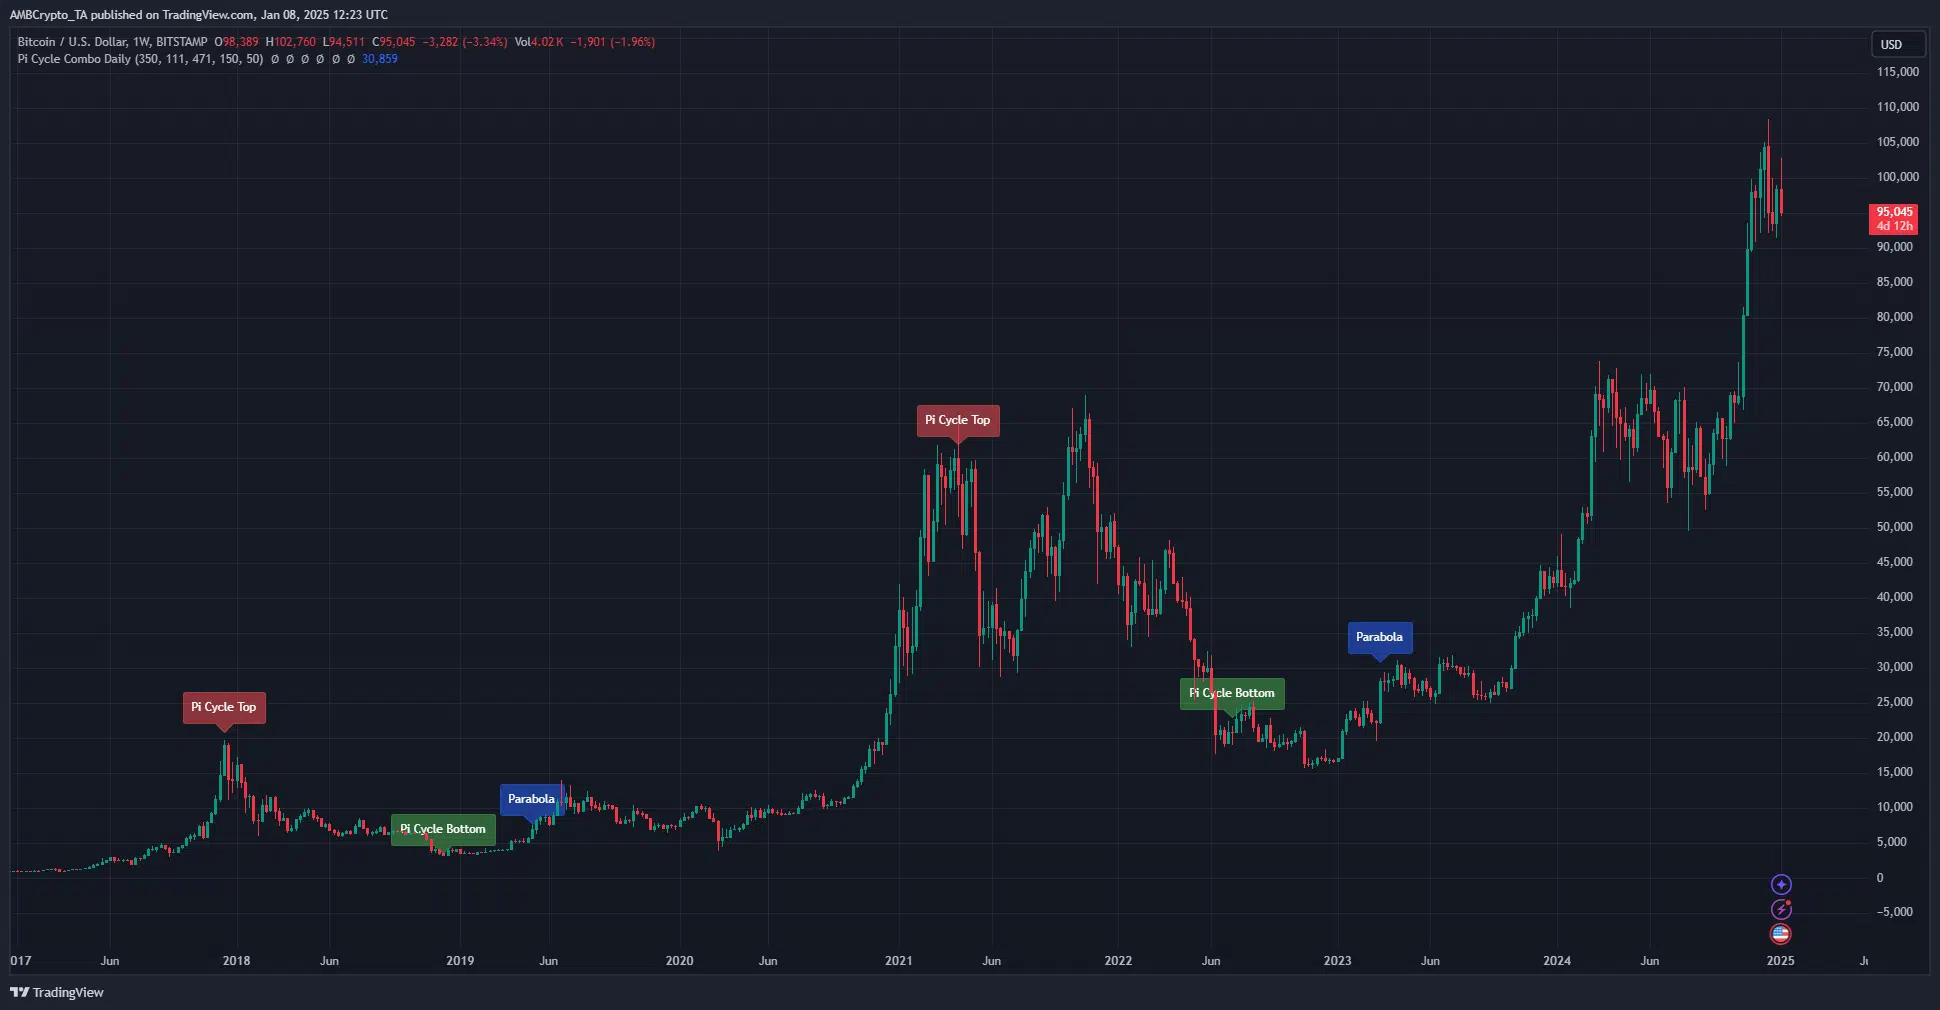
It is hard to quantify when a crypto cycle’s top has arrived. A well-known indicator is the Bitcoin Rainbow Chart. Another is the Pi Cycle Top indicator.
This indicator uses the 111-day and a multiple of the 365-day moving averages. Their bullish crossover would mark the cycle top.
Meanwhile, the 150-day moving average and a multiple of the 471-day moving average is used to find the cycle bottom. A deeper explanation can be found here.
Some popular BTC top indicators are CryptoQuant’s NVT Golden Cross or the Puell Multiple. Many of these top signals involve on-chain metrics.
For example, Puell Multiple uses the ratio of daily to yearly coin issuance to find buy and sell regions.

Source: CryptoQuant
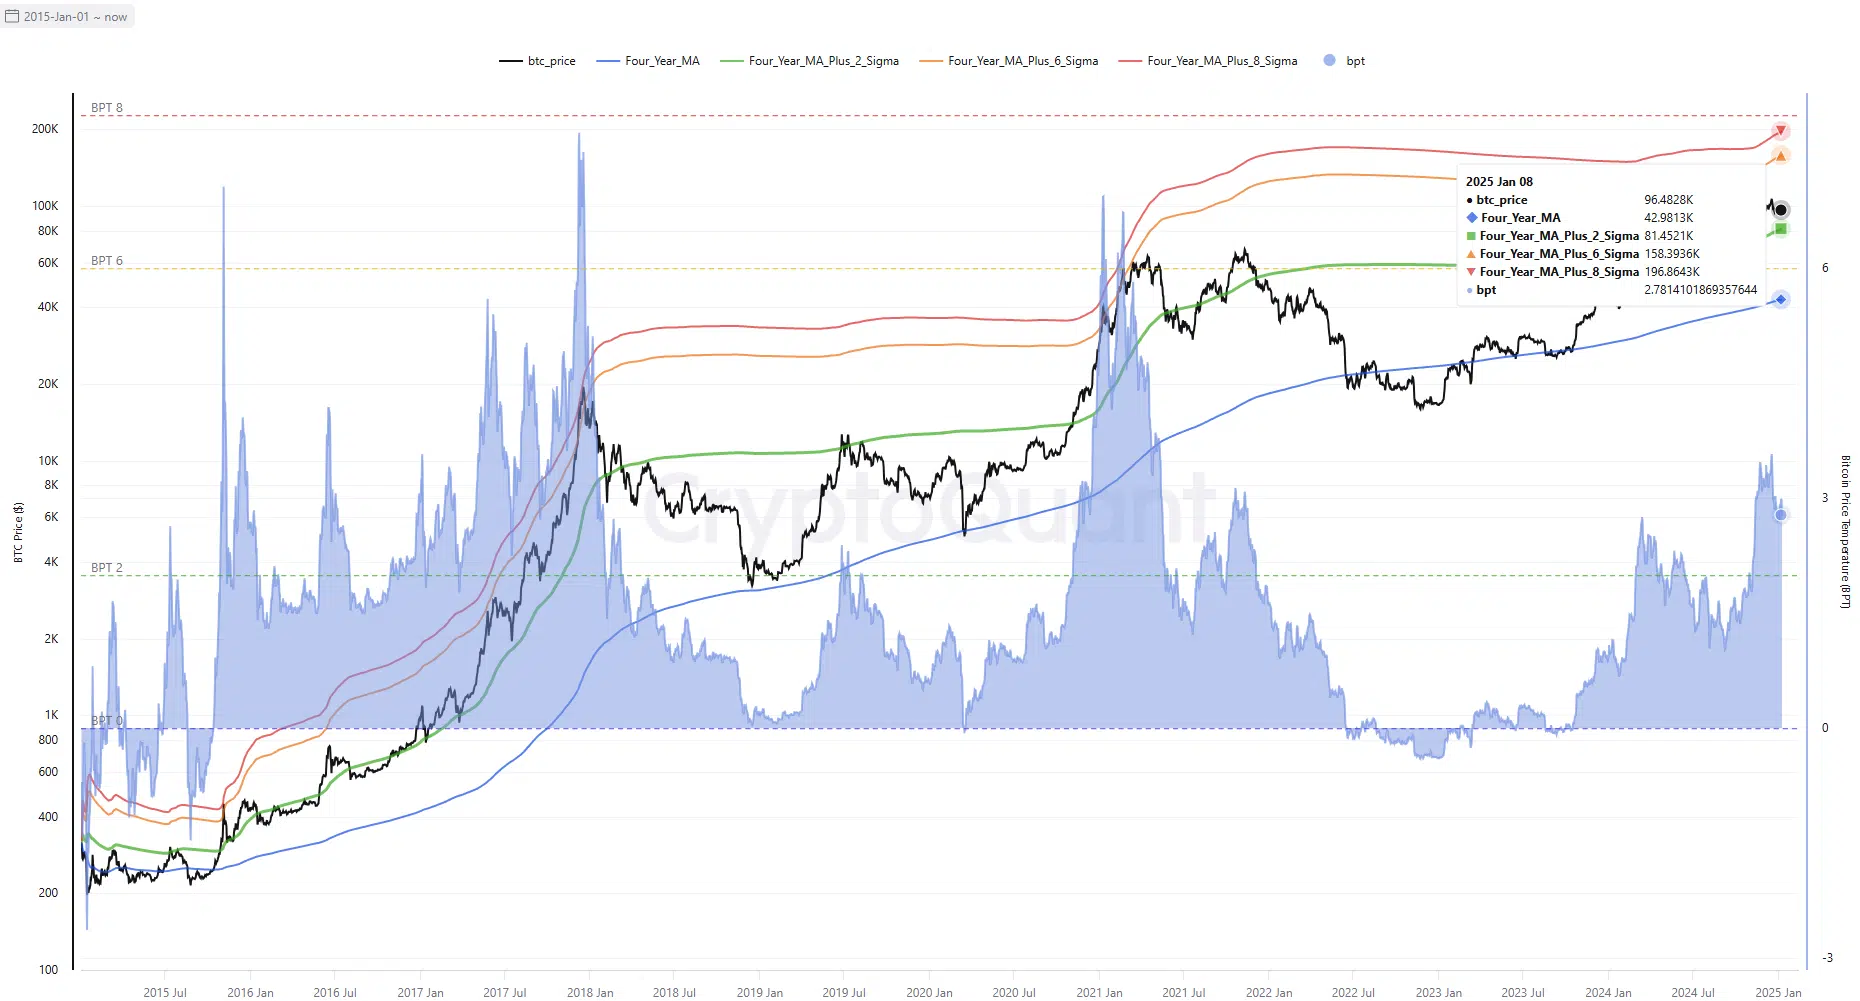
Created by crypto analyst Axel Adler, the Bitcoin Price Temperature metric uses the 4-year moving average.
It is an oscillator that models the number of standard deviations by which the Bitcoin price has deviated from the 4-year moving average.
From the chart, above, it can be seen that the price (black) is barely above the 4-year MA plus 2 sigma (or two standard deviations from the 4-year MA).
In the past, a bull run was considered to be heating up and near the top when the price was six standard deviations above the moving average.
Read Bitcoin’s [BTC] Price Prediction 2025-26
At press time, 4-year MA plus 6 sigma was at $158k. Hence, Bitcoin nowhere close to a cycle top.
Additionally, if the BPT would prove right once again, then we can expect BTC to reach at least $158k and push higher before the market can be considered “heating up”.


