After a record-setting Q3, the demand impulse that pushed BTC into six-figure territory is cooling. The daily tape now looks very different from the “straight-up” ETF bid we got used to earlier this year.
What does this new flow regime mean for price, especially heading into the final stretch of 2025?
ETF inflows flip negative
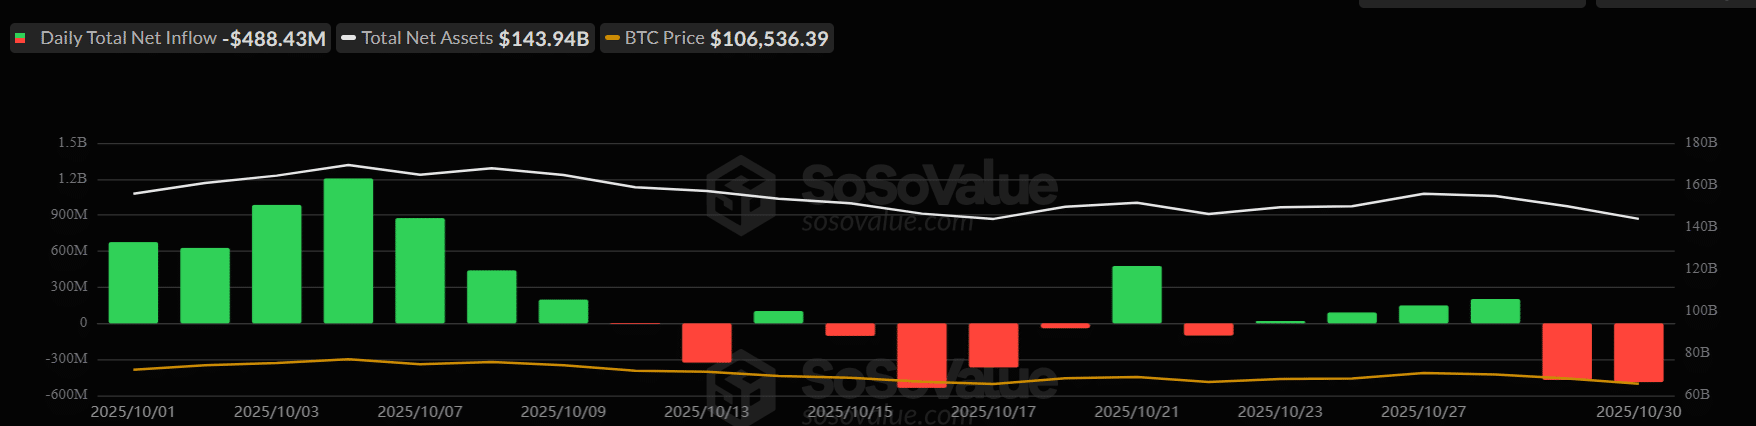
October ETF flow data showed a change in demand.
Source: SoSoValue
Early-month inflows ranged between $600 million and $1.2 billion per day, pushing total ETF net assets toward the $150 billion zone.
In mid-to-late October, the situation changed significantly. Outflows began to increase, with several days showing more than $300 million in net redemptions.
During this period, Bitcoin mirrored this decline closely. It dropped from highs of $121,000 early in the month to $106,000 by the end of the month.
The ETF market is moving the price in real time.
Retail bids absent
The bleed was not just in ETF Netflows, it was in Spot demand too!
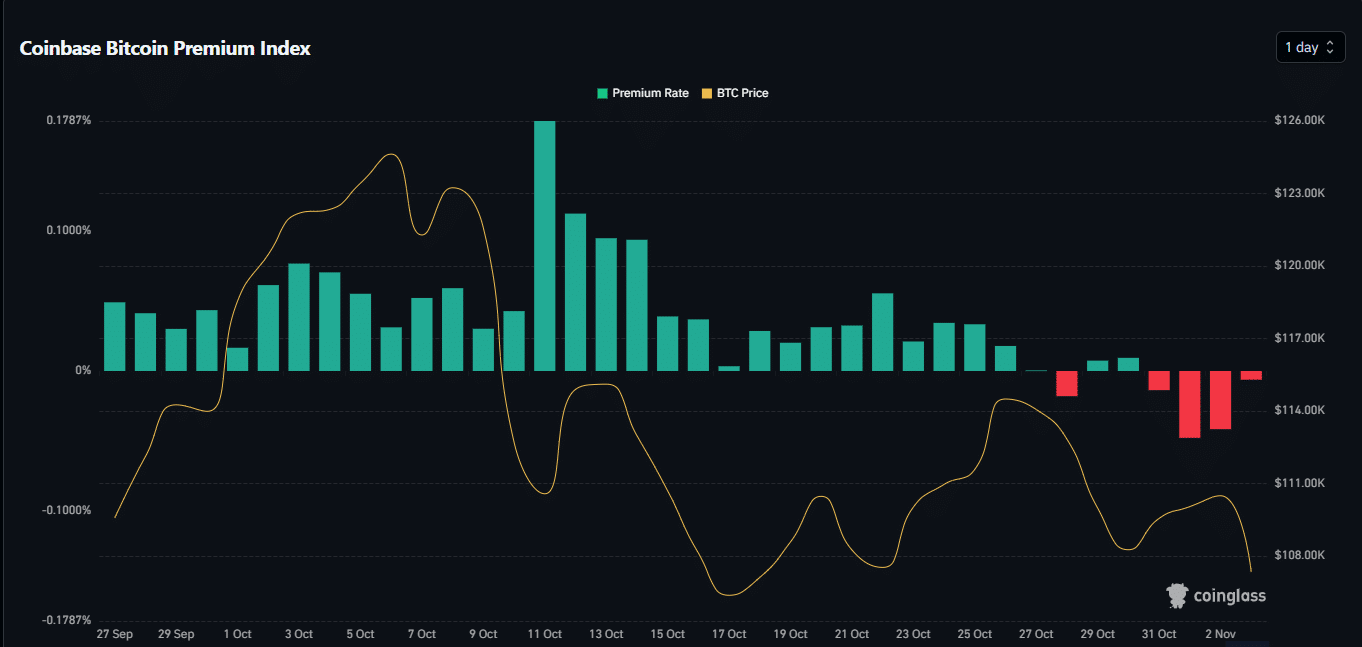
Source: CoinGlass
The Coinbase Premium Index flipped negative in the final stretch of October, right after the early-month ETF inflow spike faded. That’s a clean confirmation of the fact that capital is not chasing breakout levels anymore.
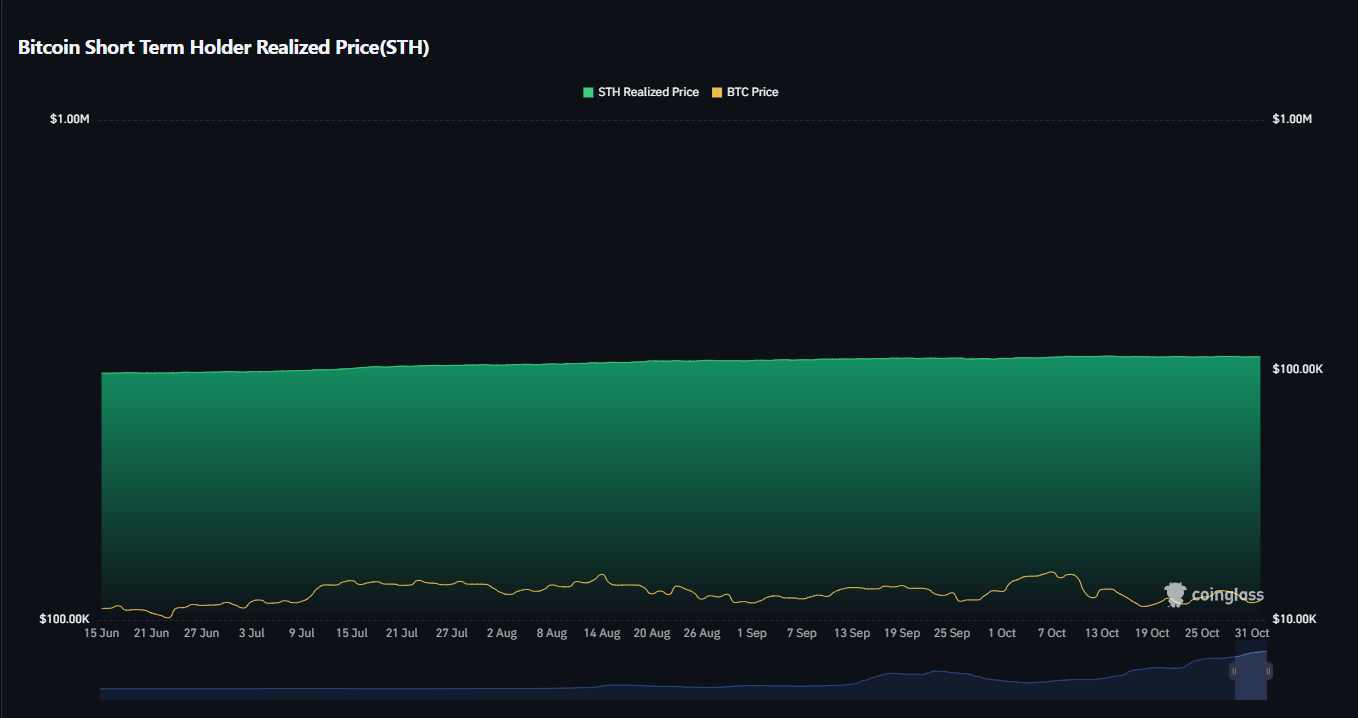
Source: CoinGlass
It also aligned with STH Realized Price sitting right at spot; short-term holders were not underwater, but they were not bidding aggressively either.
Until flows flip green again, this is the definition of a weak demand environment in Q4.
Sellers still have control
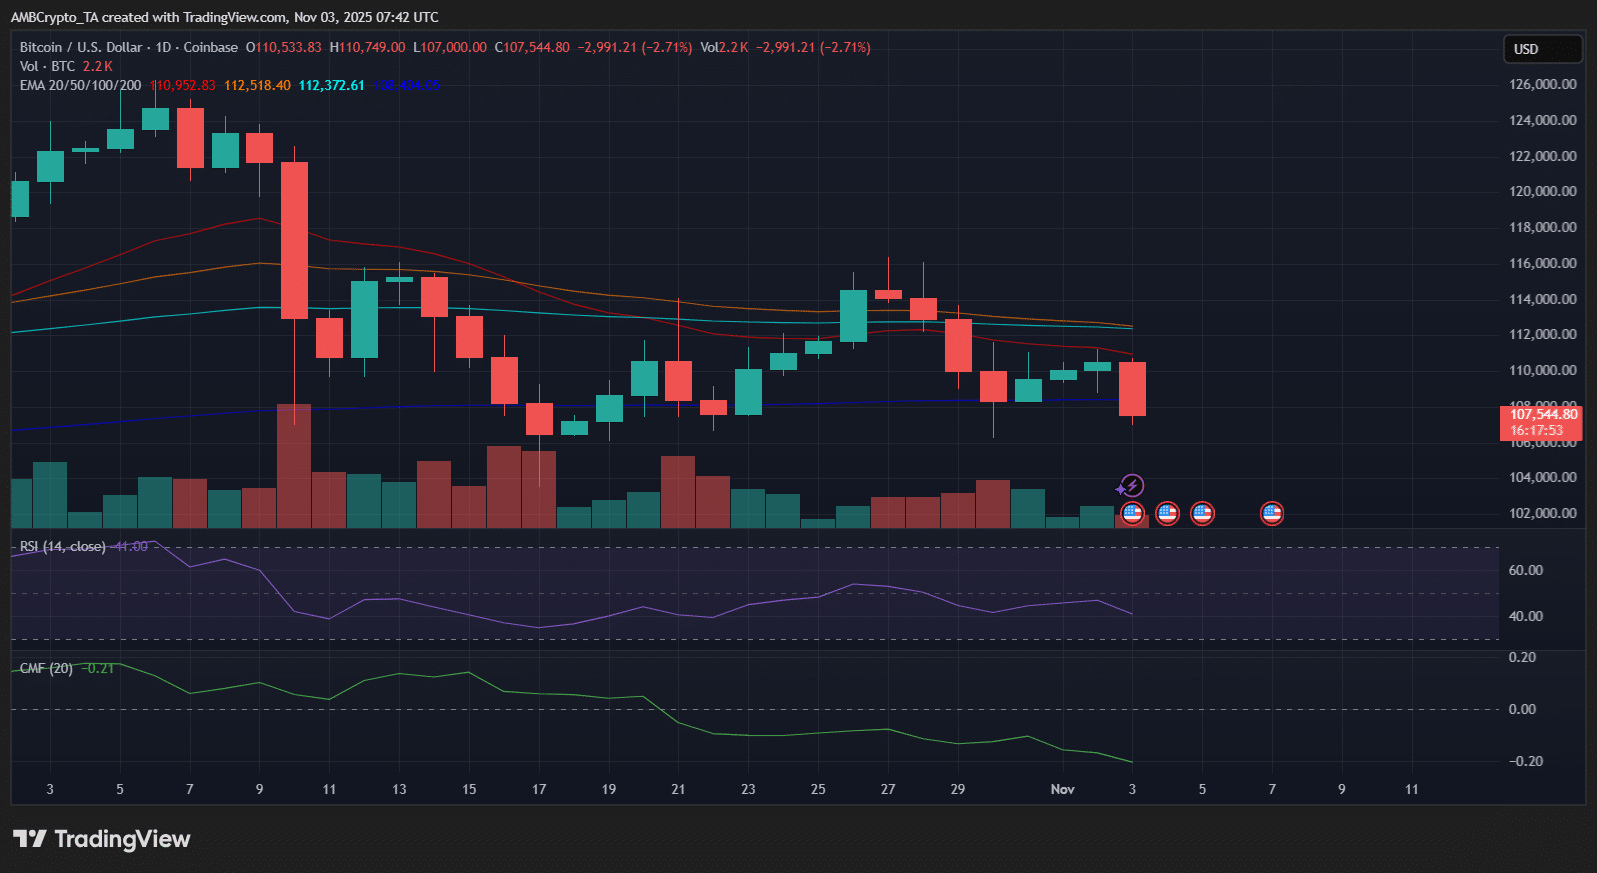
At press time, BTC’s daily chart traded below all key EMAs (20/50/100/200), rejecting the $110K region and selling down toward $107.5K.
Source: TradingView
Volume skew was red-heavy, RSI was stuck around 41, and CMF is still negative below 0, meaning money flow is not rotating back in yet.
This lined up perfectly with the ETF flow bleed and the negative Coinbase premium. Until fresh Spot and ETF buy pressure returns, this market is priced for continued stalling.
Samyukhtha L KM is a Financial Journalist and Market Analyst at AMBCrypto whose work is defined by one central question: Is the latest trend in blockchain hype, or history in the making?
Her expertise is built on a strong academic foundation, with a Master’s in Journalism and Mass Communication from Amity University and a Bachelor’s in Commerce from the University of Madras. This dual qualification equips her with a unique skill set: the financial acumen to dissect market mechanics and the journalistic rigor to investigate and communicate complex subjects with clarity.
Samyukhtha specializes in analyzing the socio-economic impact of blockchain adoption and assessing the viability of new market narratives. This includes a focus on high-velocity, community-driven assets such as memecoins, where she evaluates sentiment and fundamentals. She is dedicated to providing readers with insightful, well-researched commentary that looks beyond immediate market moves to understand the long-term implications of decentralized technology.


![Real-world assets [RWA]: How to invest in Gold & Real Estate on-chain](https://eng.ambcrypto.com/wp-content/uploads/2026/02/Samyukhtha-5-400x240.webp)