Shiba Inu: Why you shouldn’t bet big on SHIB’s 6% hike

- SHIB’s price has climbed by 6% in the last seven days.
- However, this has been supported by no real demand for the memecoin.
Leading meme asset Shiba Inu [SHIB] may shed its last week’s gains, as technical indicators observed on a 1-day chart showed that the rally has not been backed by any real demand for the coin.
According to CoinMarketCap’s data, the altcoin’s value rose by 6% in the last week. At press time, SHIB was worth $0.00002772.
However, this uptick has only mirrored the general market growth in the past seven days. CoinGecko’s data showed that due to the surge in trading activity during that period, the global cryptocurrency market capitalization has increased by 4%.
Brace for decline
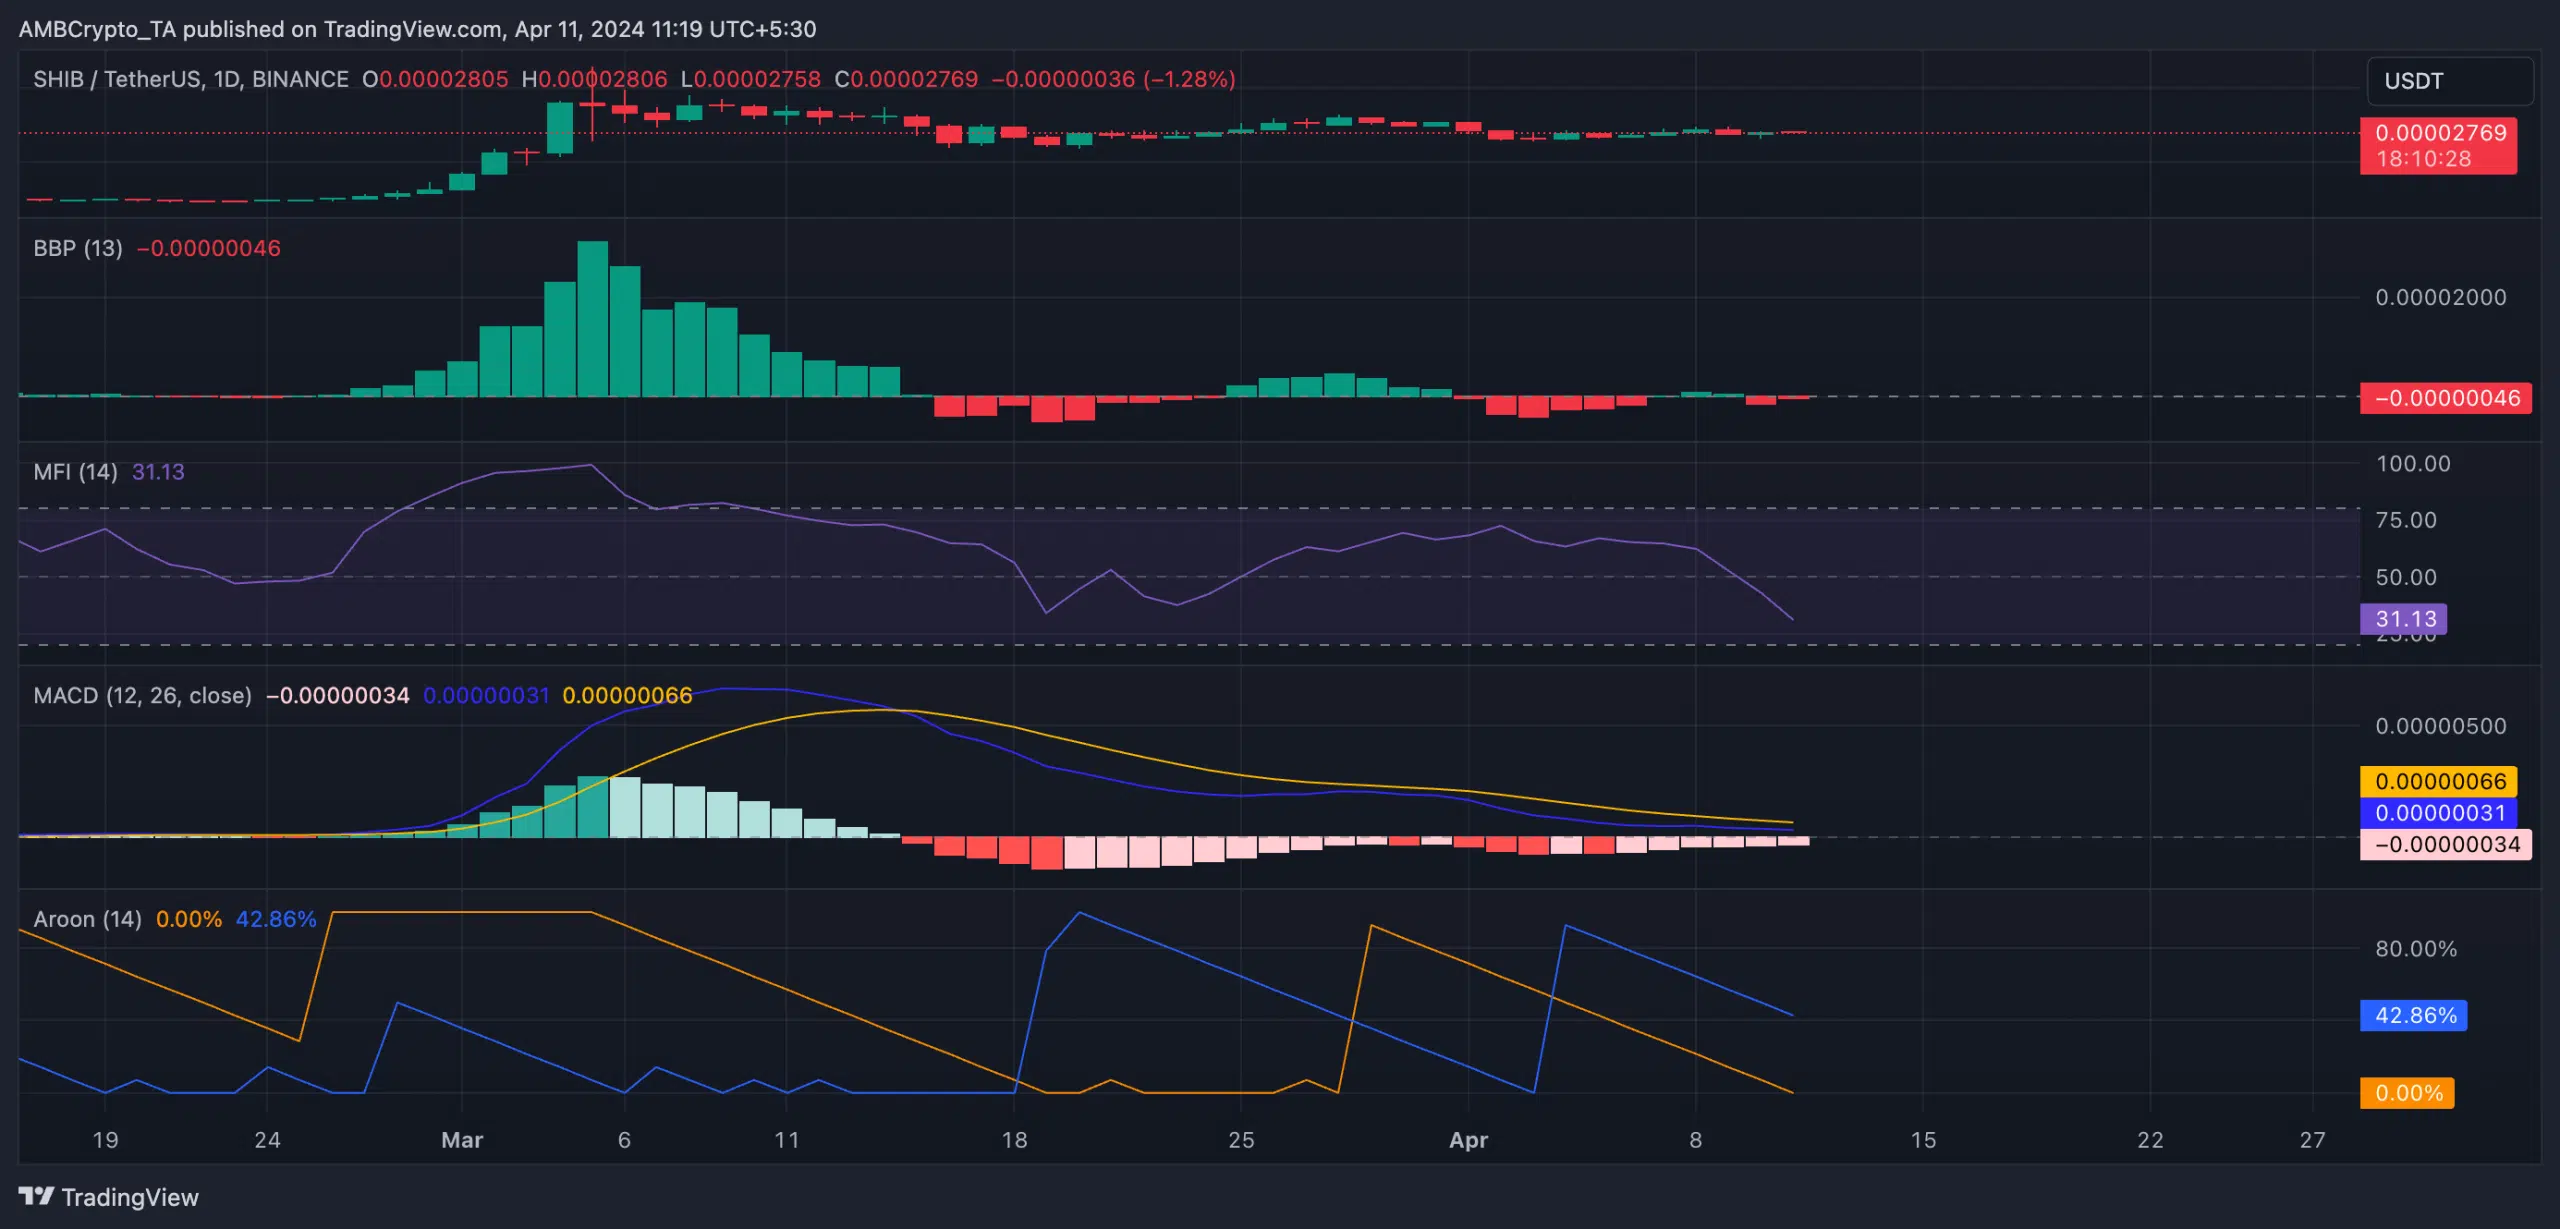
The Aroon Up Line (orange) of Shiba Inu was 0% as of this writing, confirming that last week’s rally has not been supported by any significant buying pressure.
An asset’s Aroon indicator measures its trend strength and potential trend reversal points in its price movement. When its Up Line is close to zero, the uptrend is weak, and the most recent high was reached a long time ago.
While this usually signals the possibility of a trend reversal, SHIB’s market sentiment remains significantly bearish. Therefore, in the short term, an upward correction may seem challenging.
Indicators show the entry of bears
Further, readings from SHIB’s Moving Average Convergence/Divergence (MACD) indicator showed that its short-term trend is weaker than the longer-term trend. This occurs when an asset’s MACD line (blue) rests below its signal line (orange).
This is a bearish signal, as it suggests an uptick in selling pressure. SHIB’s MACD line crossed below its signal line on 14th March, causing its price to fall by double digits in the last month.
When these lines are positioned this way, traders often interpret it as a signal to sell or stay away from entering new long positions until the MACD line crosses back above the signal line, indicating a potential reversal in the trend.
In addition, SHIB’s key momentum indicators trended downward and returned negative values at press time, suggesting a decline in demand for the memecoin.
For example, the value of SHIB’s Elder-Ray Index has been primarily negative since the beginning of the month.
Read Shiba Inu’s [SHIB] Price Prediction 2024-25
This indicator measures the relationship between the strength of buyers and sellers in the market. When it is negative, it means bear power is significant.
Likewise, the coin’s Money Flow Index trended downward and was spotted at 31.12 at press time. This value showed that market participants favored SHIB distribution over accumulation.


