Solana: Can the spike in this metric push SOL forward

- Solana’s transactions crossed 622 million in November.
- TVL has increased by over 80% in the last month.
In November, Solana [SOL] recorded the highest number of transactions, according to recent data.
Solana tops the November transaction list
Recent data from Crypto Rank showed that Solana recorded around 622 million transactions in November. This marked the highest transaction volume among the top blockchains for that month.
Examining the transaction trend for Solana in November, the lowest daily volume observed was around 29.9 million.
Also, an average daily transaction of around 35 million could be observed on the chart. Further analysis indicates a notable increase in transaction numbers for the current month, with daily transactions ranging around 40 million so far.
Top 15 Blockchains by Total Transactions in November
Solana $SOL – 622M
Polygon $MATIC – 162M
Tron $TRX – 145M
BNB Chain $BNB – 115M
Sui $SUI – 78.8M
NEAR Protocol $NEAR – 70.1M
Ethereum $ETH – 32.5M
Fantom $FTM – 31.4M
Avalanche $AVAX – 29.2M
Arbitrum $ARB – 23.1M
zkSync Era -… pic.twitter.com/7BnHJZxHDV— CryptoRank.io (@CryptoRank_io) December 5, 2023
Solana TVL continues to rise
Solana has been asserting its dominance not only in transaction volume but also in Total Value Locked (TVL), showing a recent surge.
According to a previous AMB report, Solana’s TVL witnessed a remarkable growth of over 70% in the past month. However, the most recent data, as of this writing, showed an even more substantial increase of over 87% in the past month.
The TVL trend, according to data from DefiLlama, remained the highest among the top 10 chains. Also, as of the latest update, the TVL for Solana has reached approximately $697 million.
Additionally, the network continued to maintain a strong user base. The DefiLlma data showed that the number of active addresses has consistently gone over 150,000.
This trend of sustained activity has been ongoing since November and has continued. As of this writing, the number of active addresses was over 184,000.
SOL catches a break
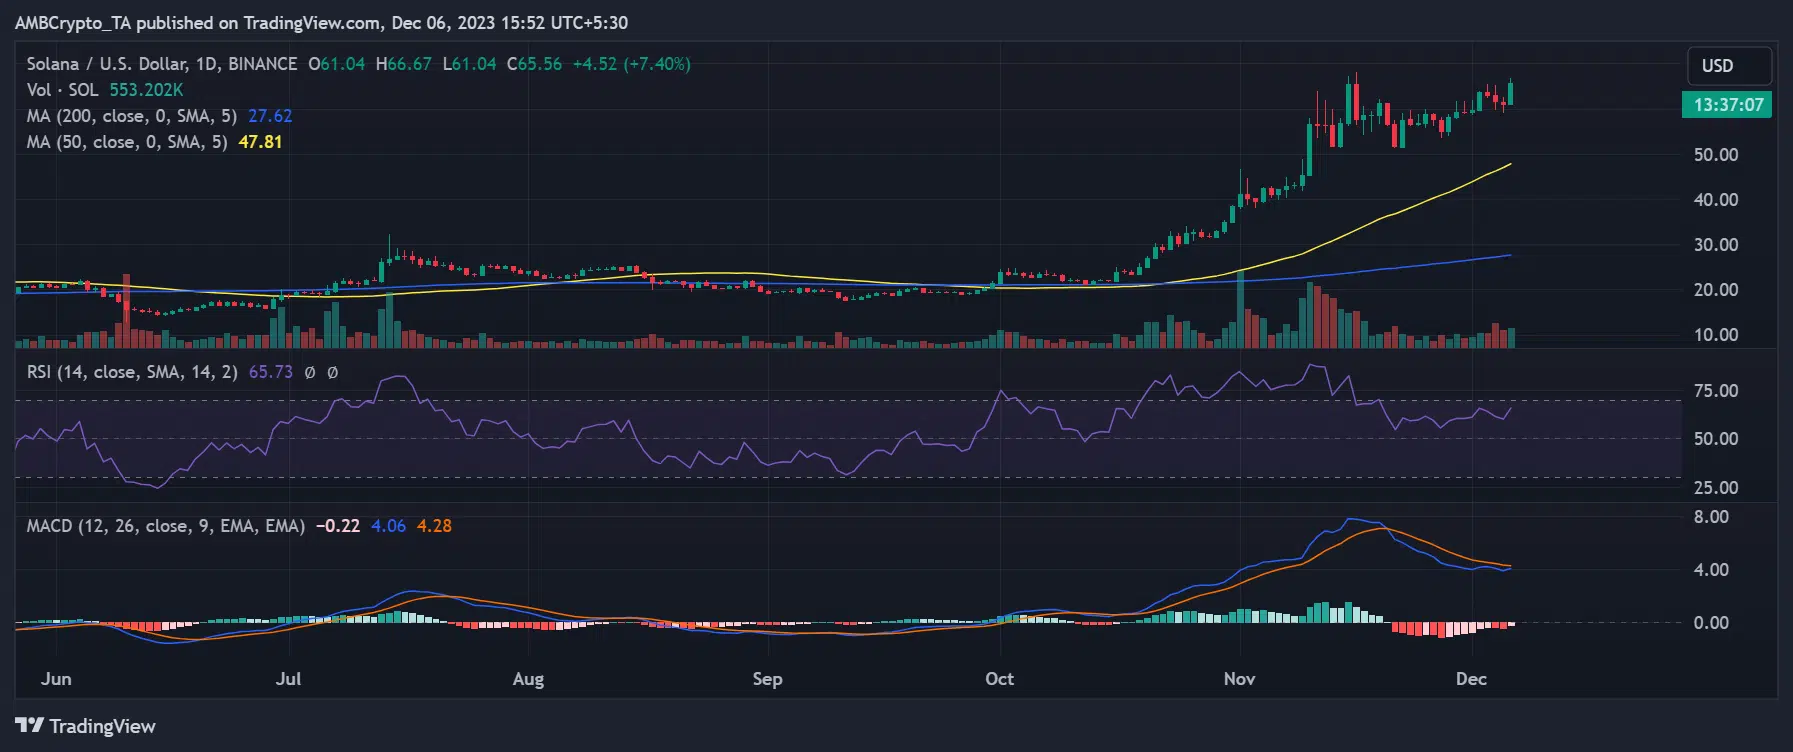
An analysis of the daily timeframe chart for Solana showed a recent series of losses in the past few days. However, a positive turn was evident as of this writing.
At the time of this report, SOL was trading with a notable increase of over 7% in value. The spot price has climbed to over $65, surpassing the previous trading session’s range of around $61.
Is your portfolio green? Check out the SOL Profit Calculator
While it may not be at the forefront of leading assets in terms of price uptrends, it showcased an impressive upward movement in the last few months.
Furthermore, the trend line analysis showed a support level in the vicinity of the $50 and $51 price ranges. This suggests a stabilizing factor for Solana in the face of recent fluctuations.


