Litecoin, IOTA, Waves Price Analysis: 13 February

Litecoin breached its psychological resistance of $200, with the crypto projected to maintain its northbound movement in the short-term. IOTA was also bullish at the time of writing, but some oversaturation was noted in its market. Finally, WAVES moved within an ascending triangle and awaited a breakout on the charts.
Litecoin [LTC]

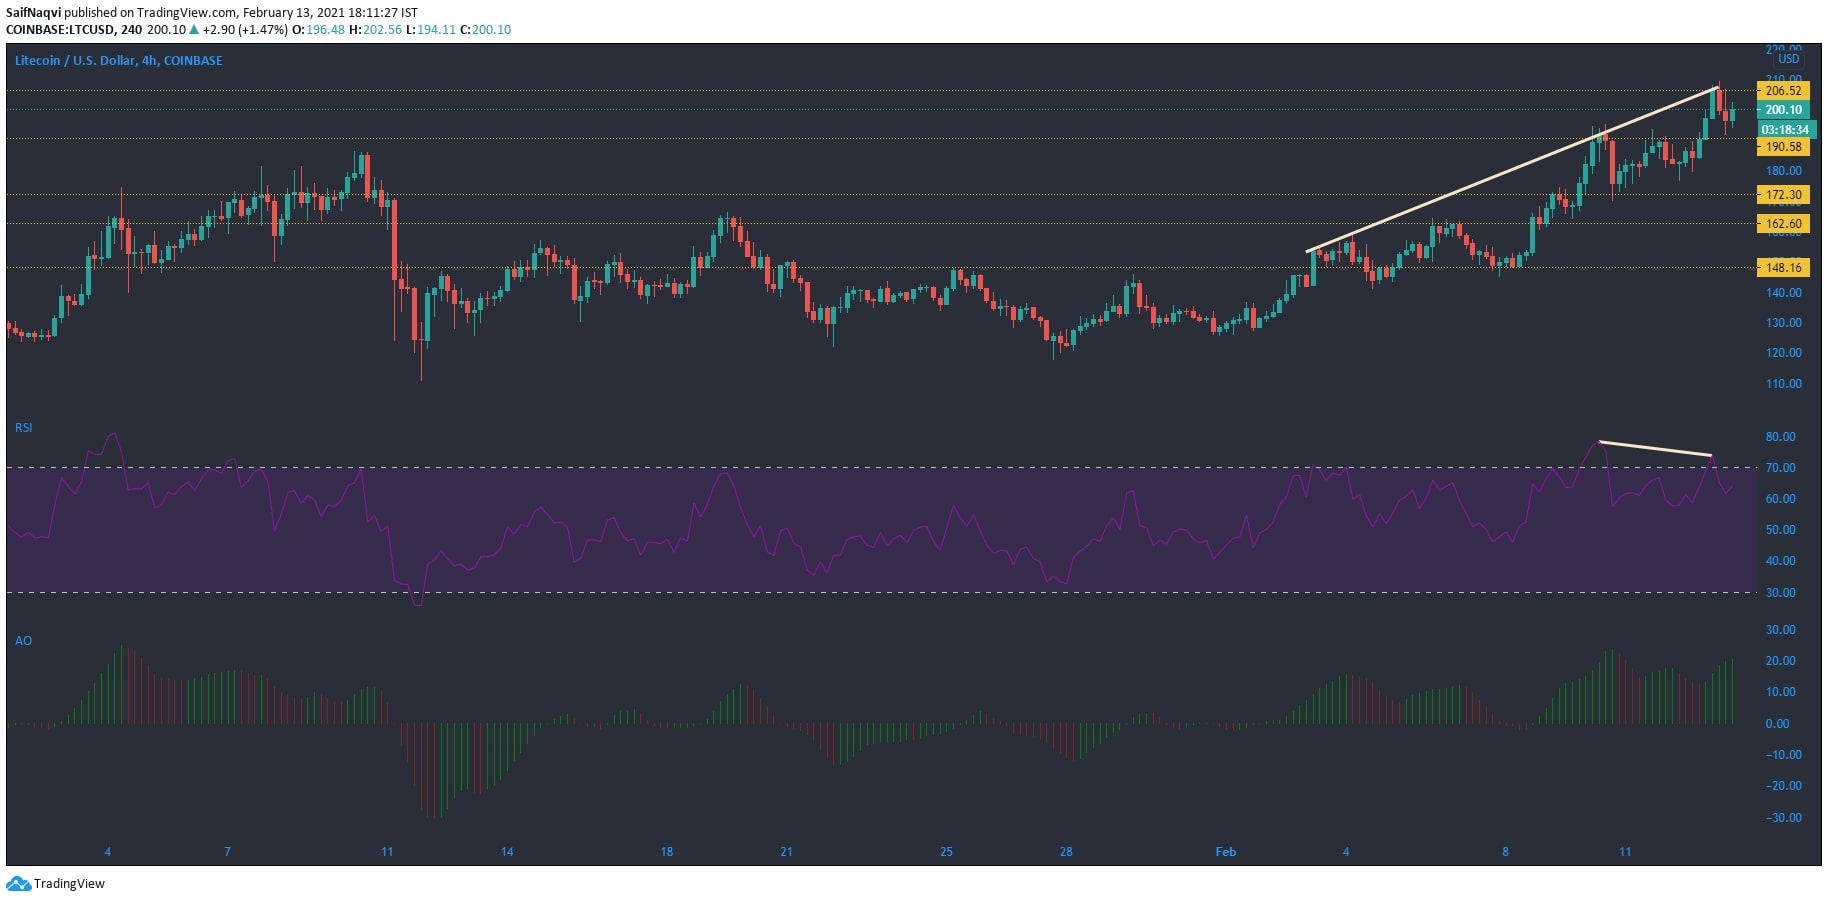
Source: LTC/USD on TradingView
A bullish rally in the last seven days saw Litecoin climb to a local high of over $200 after a subdued start to the month. Even after the price moved lower after a bearish divergence on the RSI, LTC picked up once again at the time of writing and eyed its immediate resistance level. The RSI also looked to revisit the overbought zone as the trading volume rose north of $13.5 billion.
The Awesome Oscillator noted rising momentum on the buying side and a break above the $206-resistance was likely in the coming sessions.
IOTA

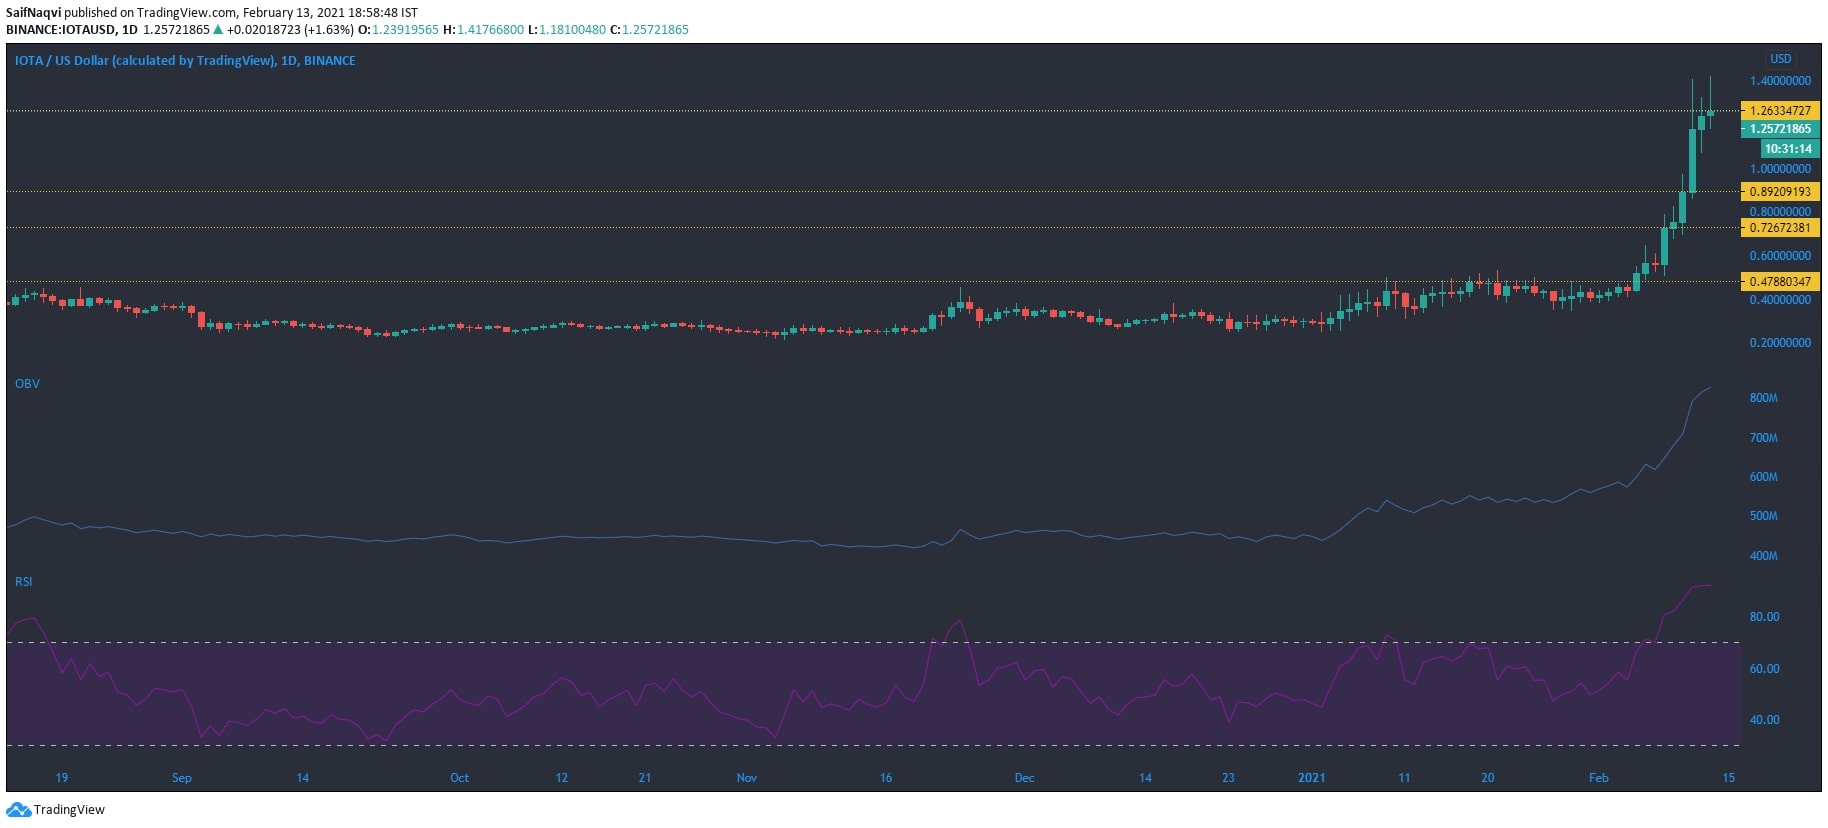
Source: IOTA/USD on TradingView
IOTA climbed above the $1-level on the back of strong buying pressure over the last few days as the price traded at a two and a half year high, at the time of writing. The buying pressure in the market was captured by the OBV, with the same rising sharply along with the price. On the downside, the RSI traded heavily in the upper region, with the same suggesting that a correction was overdue for the cryptocurrency. Chances of a pullback were heightened further after the trading volumes shrunk by over 40%.
In the event of a pullback, the support levels lay at $0.89 and $0.72 on the daily chart. On the flip side, a favorable scenario would see the bulls target the $1.5-psychological level.
Waves [WAVES]

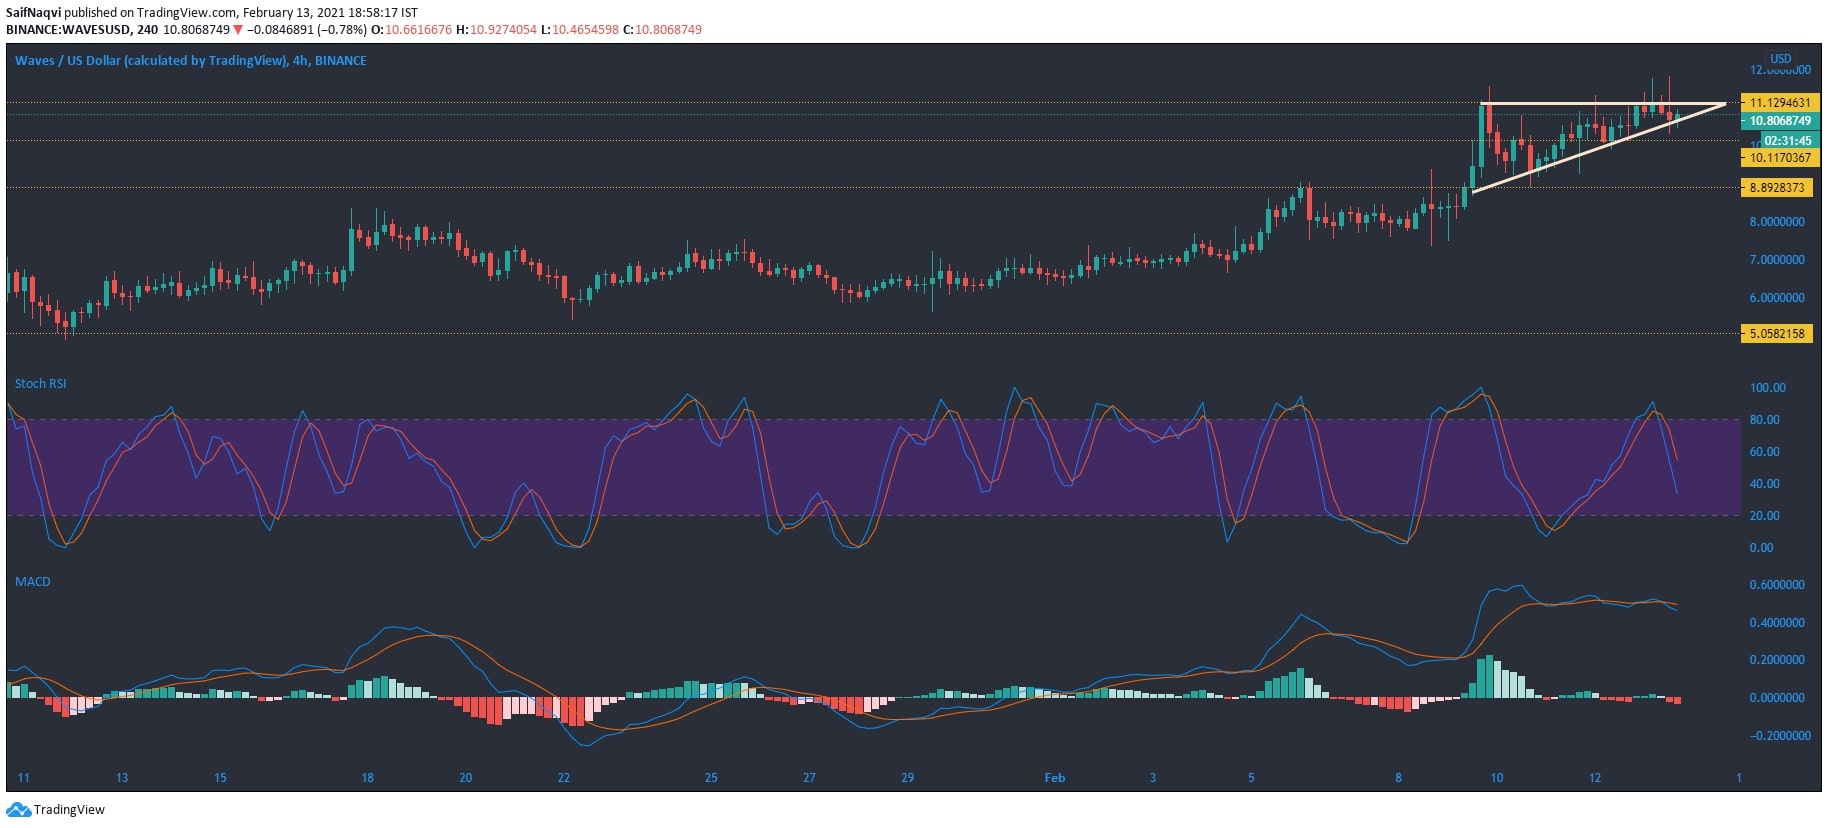
Source: WAVES/USD on TradingView
Waves surged by over 6%, at the time of writing, as the market’s bulls targeted a breakout from an ascending triangle pattern. However, the bulls might have to wait a little longer for the breakout as the indicators backed the bears in the short-term.
The Stochastic RSI eyed the oversold zone while a bearish crossover was observed by the MACD. If the technicals hold, WAVES could test the support levels at $10.1 and $8.9. If an upwards breakout happens, sooner than anticipated, the cryptocurrency could rise above the $12-mark.
