
Disclaimer: The findings of the following analysis should materialize within the next 24-48 hours
With Bitcoin and Ethereum leading the price rally over the past few years, it was fairly obvious that major altcoins in the top 10 would take some part in the rally as well. The narrative was the same for Bitcoin SV, with the crypto-asset breaching its resistance at $188 for the first time since 9 July. In fact, the crypto-asset was up by 4.57 percent over the past 24-hours, with a recorded market cap of $3.64 billion, at the time of writing.
Bitcoin SV 1-hour chart
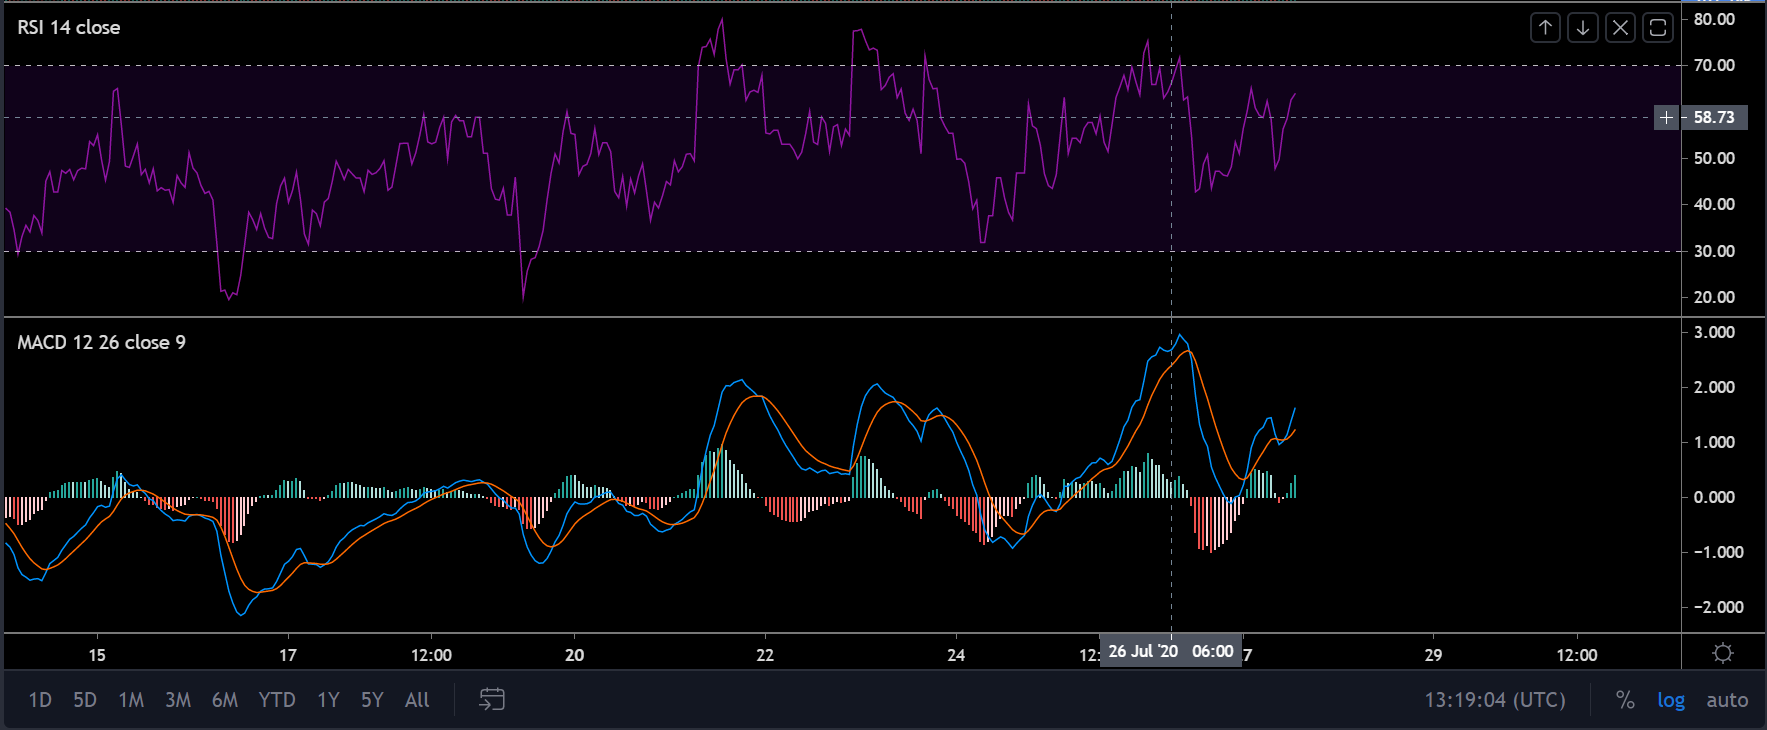
Source: Trading View
For Bitcoin SV, the rally had predominately flipped major market indicators significantly positive. While the Relative Strength Index or RSI suggested that buying pressure was immense amidst traders, the MACD noted a bullish trend for the world’s 6th largest digital token.
However, upon analysis of Bitcoin SV’s 1-hour chart, an imminent trend reversal seemed inevitable.
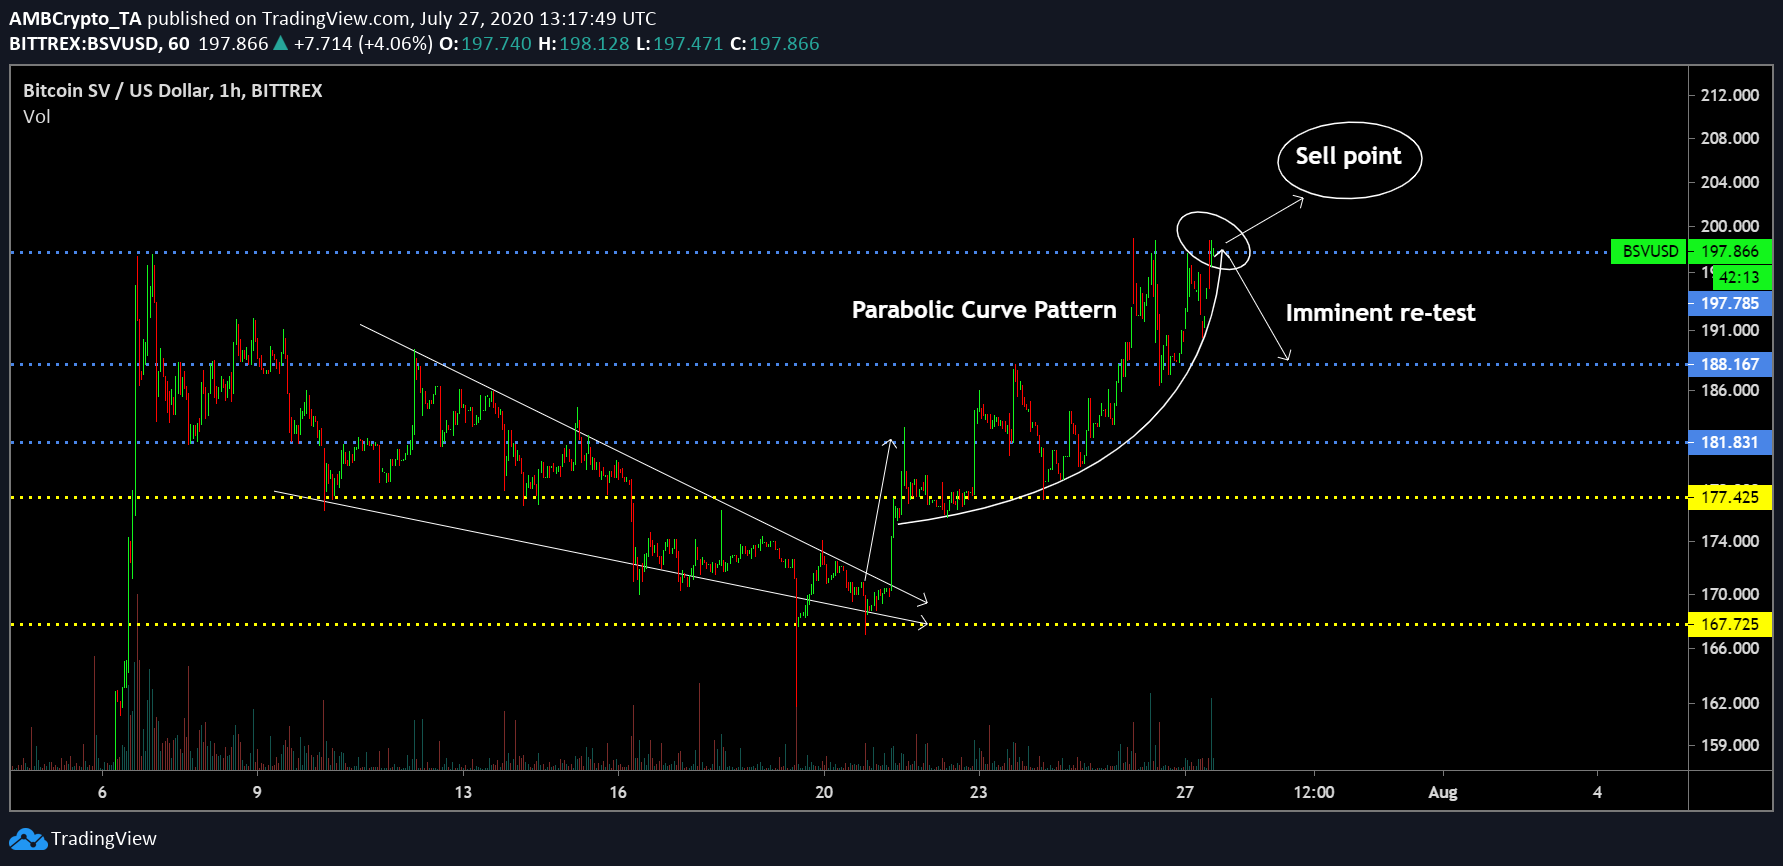
Source: BSV/USD on TradingView
Even though the crypto-asset managed to breach its immediate resistance at $188, the rise in value may crumble under the pressure at $197. After registering a minor hike off the falling wedge pattern, the asset’s movement over the past week has adhered to a parabolic curve pattern.
As observed, three bases have already been formed along the curve and it is possible that the resistance at $197 is a sell-point. From here onwards, buyers are likely to sell-off their positions for profits, causing the price to register an immediate re-test of $188. With inconsistent trading volume backing the rally, the possibility of a pullback is likely.
However, if the rally were to continue on Bitcoin’s end, the collective push upwards may arrive as well, following which an eventual decline may be inevitable.
Bitcoin SV 4 hour chart
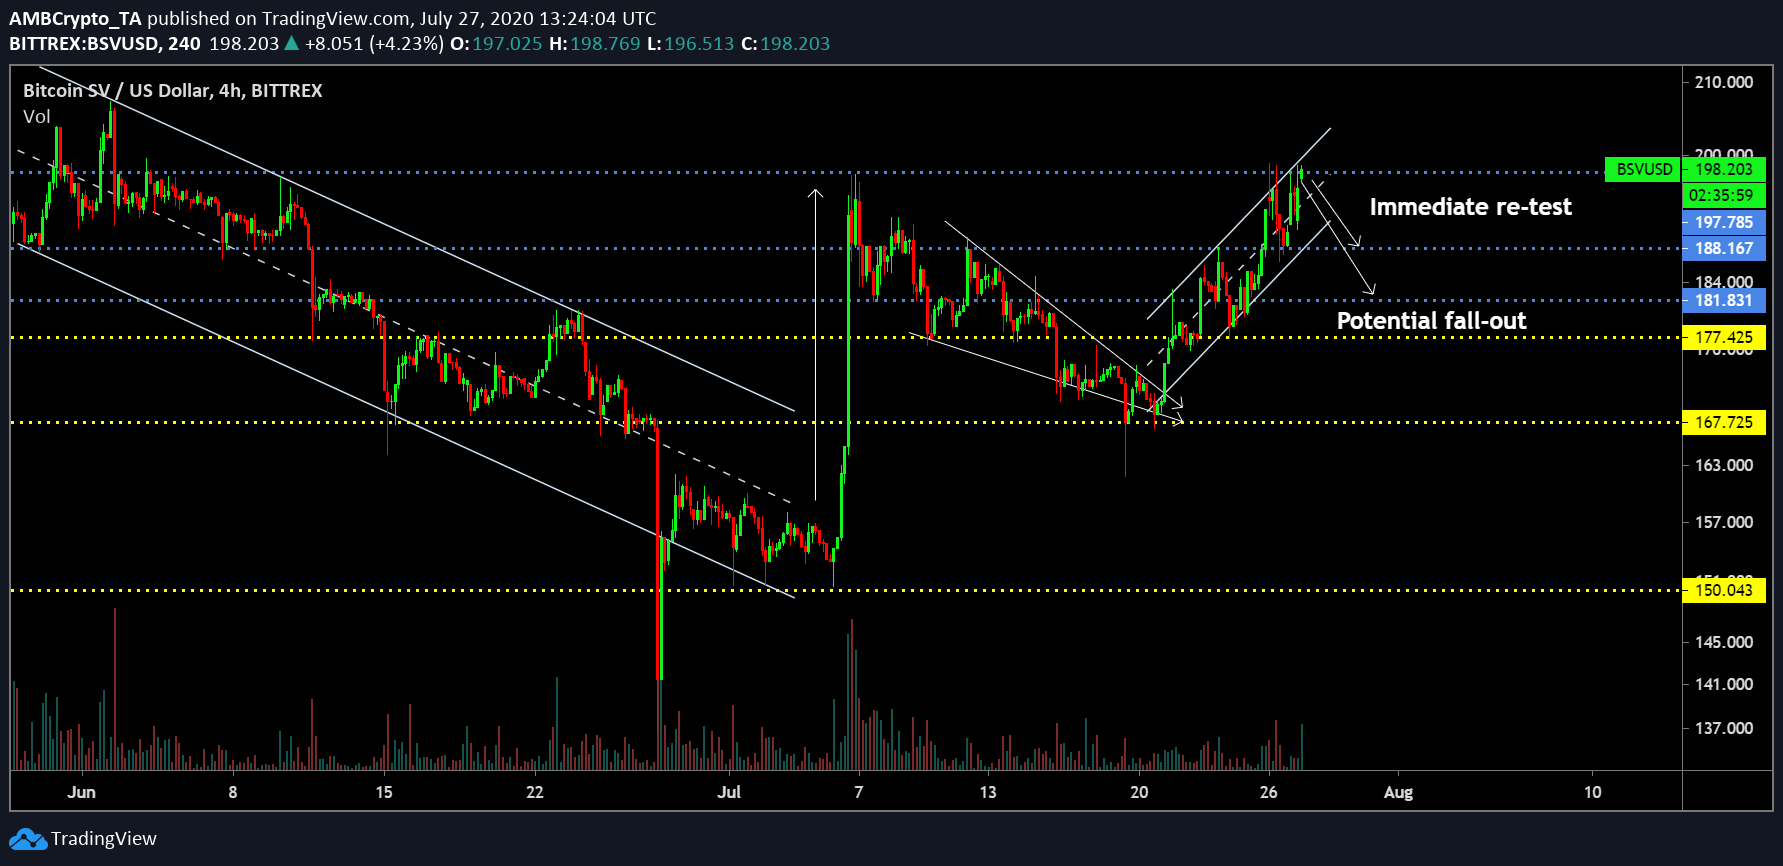
Source: BSV/USD on Trading View
Bitcoin SV’s 4-hour chart did not indicate a different scenario either.
At press time, the asset was moving within the trend lines of an ascending channel, one that was destined to undergo a pullback as soon as the bullish momentum faded away on the charts. As mentioned previously, the immediate resistance was at $188, but further sell-off can lead to the crypto-asset falling towards $181.
Conclusion
The crypto-asset is likely to fall to $188 over the next few days, but it may consolidate at the current range for the next few hours at least.