Analysis

Ethereum could’ve sparked a falling-wedge breakout, despite the lurking Death Cross
Posted:

A bug may have pushed Ethereum to the top spot on CoinMarketCap, but its bullish tendencies cannot be understated. The second largest cryptocurrency on the market is now resurrecting from its dismal performance over the past couple of weeks, and this morning’s 9 percent daily price gain may be a sign of things to come.
The market woke up to an altcoin flourish, led in large part by XRP and Ethereum, the two top dogs. In comparison, Bitcoin’s 24-hour price gain of less than 0.5 percent was quite poor, sparking a flashback to the altseason of early 2019. Ethereum, in XRP’s shadow, as the current market performance goes, is showing massive gains and the charts have a surprise for its proponents.
SHORT TERM
Sounce: Trading View
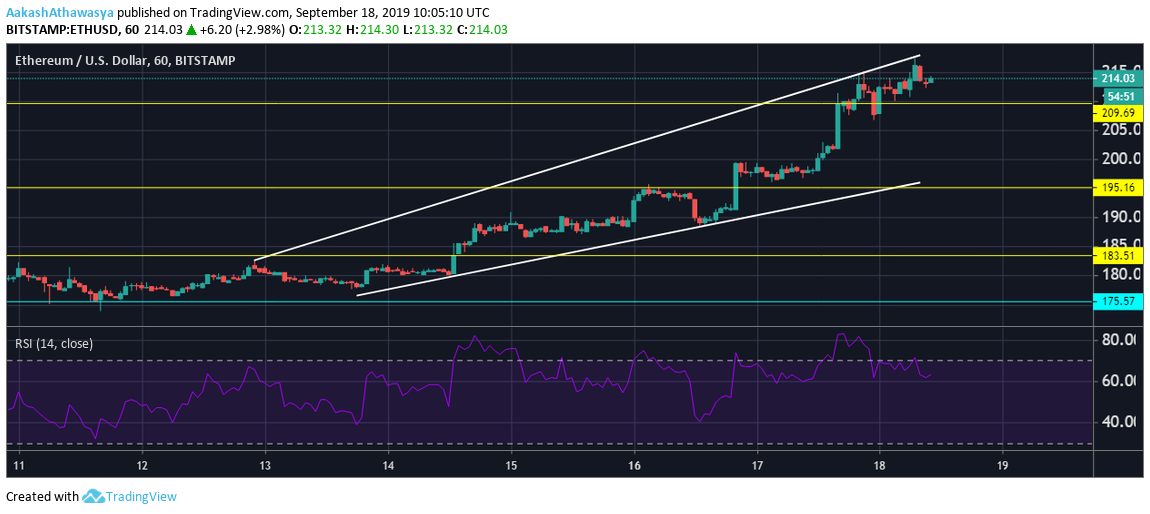
In the short-term, the current price rise overshadows the prolonged movement. However, a clear rising wedge, if not a channel, can be seen as ETH is on a consistent move-up.
From 7 September to 14 September, the price bounced off the resistance and support level placed at $175 and $183, respectively, moving in a parallel channel. The initiator to the current upswing in ETH prices occured on 14 September, with the price going as high as $188. The next resistance level which was broken was at $195, followed by the psychological resistance of $200. Owing to the bullish performance all through September 17, Ethereum broke the $209 resistance as well, and is now trading comfortably at over $213.
The parallel channel looks to move further, coupled with other healthy signs. The Relative Strength Index is holding strong, despite dropping below 70.
LONG TERM
Sounce: Trading View
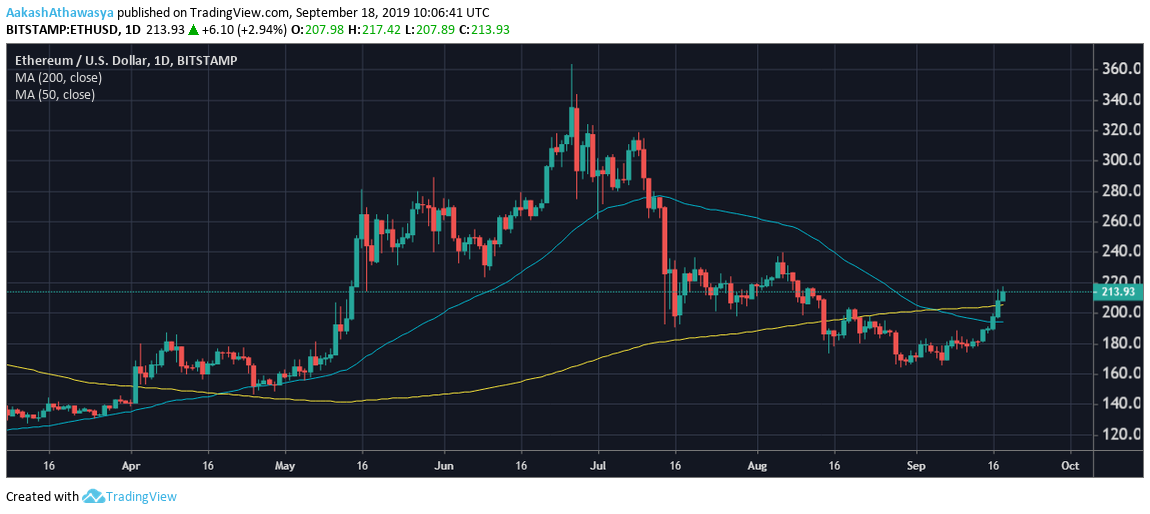
An important caveat before looking at the one-day chart is the looming Death Cross for Ethereum. Formed as a result of the overtake of the 50-day Moving Average by the 200-day Moving Average, Ethereum entered its Death Cross on 4 September, sealing shut its ‘golden’ period which commenced on 18 April.
Sounce: Trading View
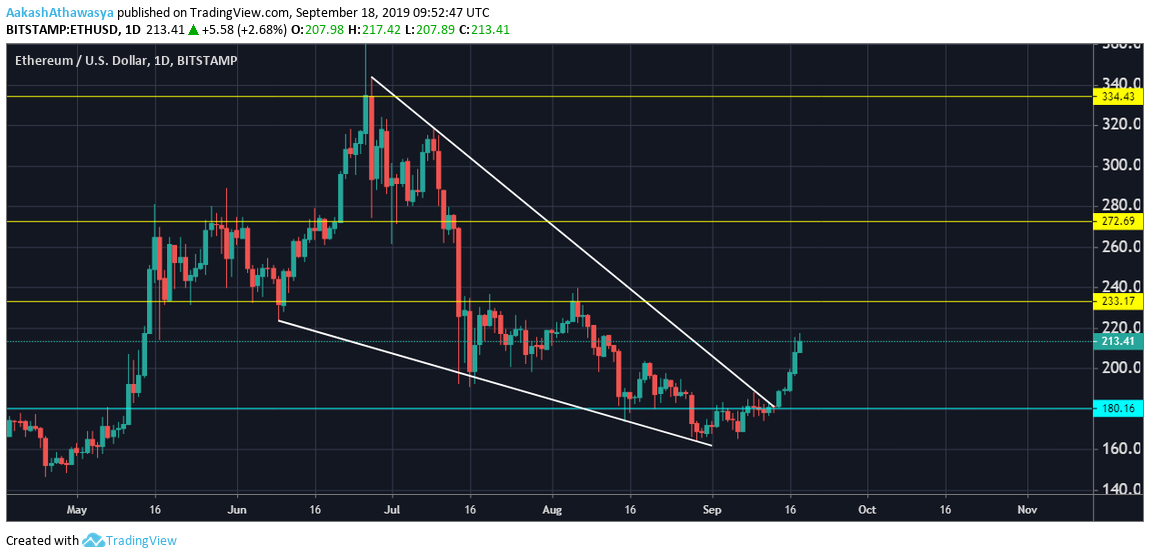
Ethereum, despite falling by over 35 percent against its price two months ago, is looking bullish based on early signs of a breakout from a falling wedge. The wedge, which began in late June, has seen a downward sloping Ethereum price chart, with the first indication of revival occuring on 13 September. The next five days saw the top altcoin surge by 17.52 percentage, and it’s not done yet.
The successive and immediate increase in price saw Ethereum move out of the falling wedge, which showed signs of flattening towards the end of August. Despite the Death Cross, which generally indicates the coming of long-term bearish momentum, the breakout looks to be bullish. If this surge persists, the key resistance levels that should be looked at with anticipation are placed at $233, $272 and $334.