
Bitcoin saw a dip from $19,500 to $18,500 in the past couple of days and was trading at $18,919 at the time of writing. Bitcoin Cash had a few days of calm sideways trading but could be headed lower in the coming hours. Ontology indicated a breakout was imminent, with the direction not yet confirmed. Enjin exhibited volatility in the short-term but offered opportunities to swing trade.
Bitcoin Cash [BCH]
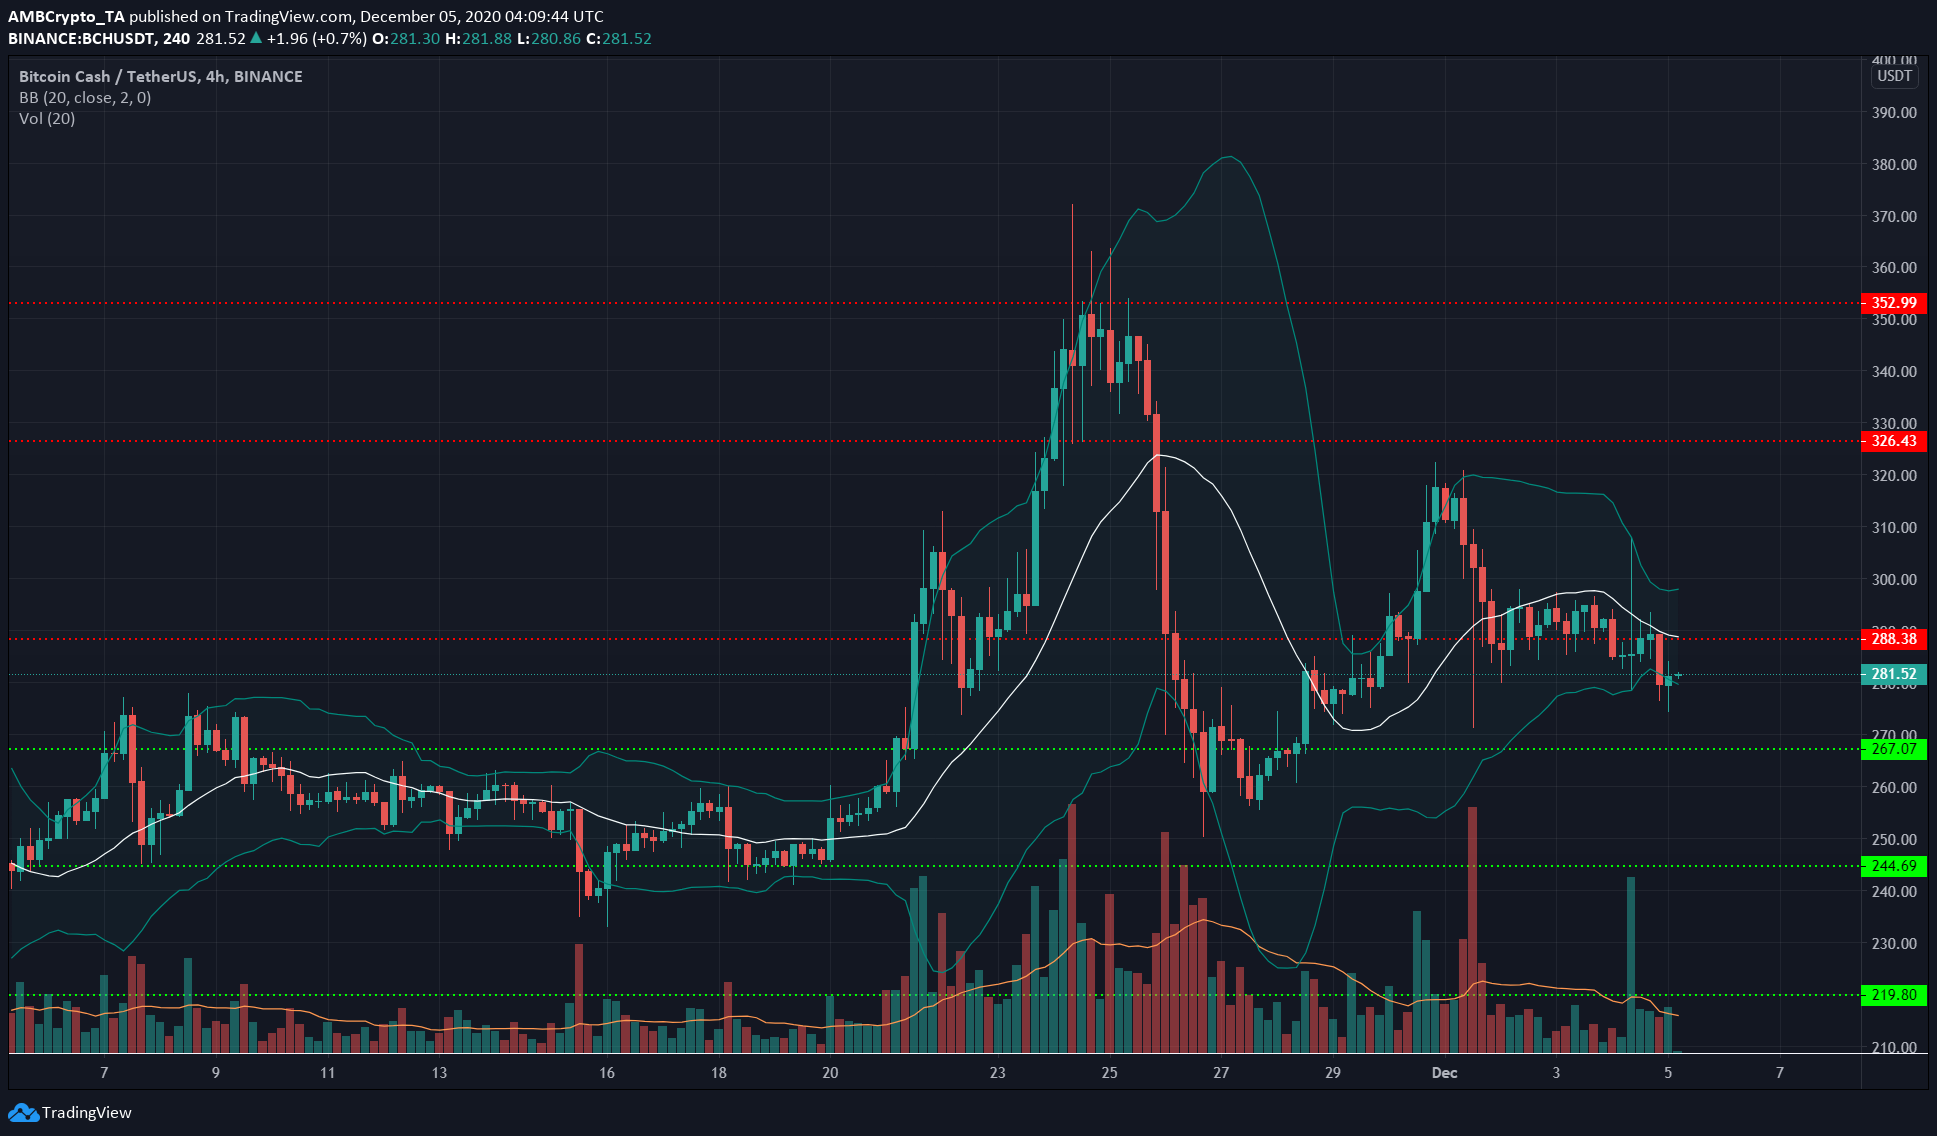
Source: BCH/USDT on TradingView
The Bollinger bands were beginning to tighten around BCH following its consolidation above the $288 support since 1 December, but the price dropped below that level in recent hours and the bands began to widen once more.
Since reaching a local high at $360, the price has formed lower highs and could form a descending triangle pattern, with a base at the $260 level in the coming days.
Before that can materialize, $274 is a level that has to be breached by the bears.
Ontology [ONT]
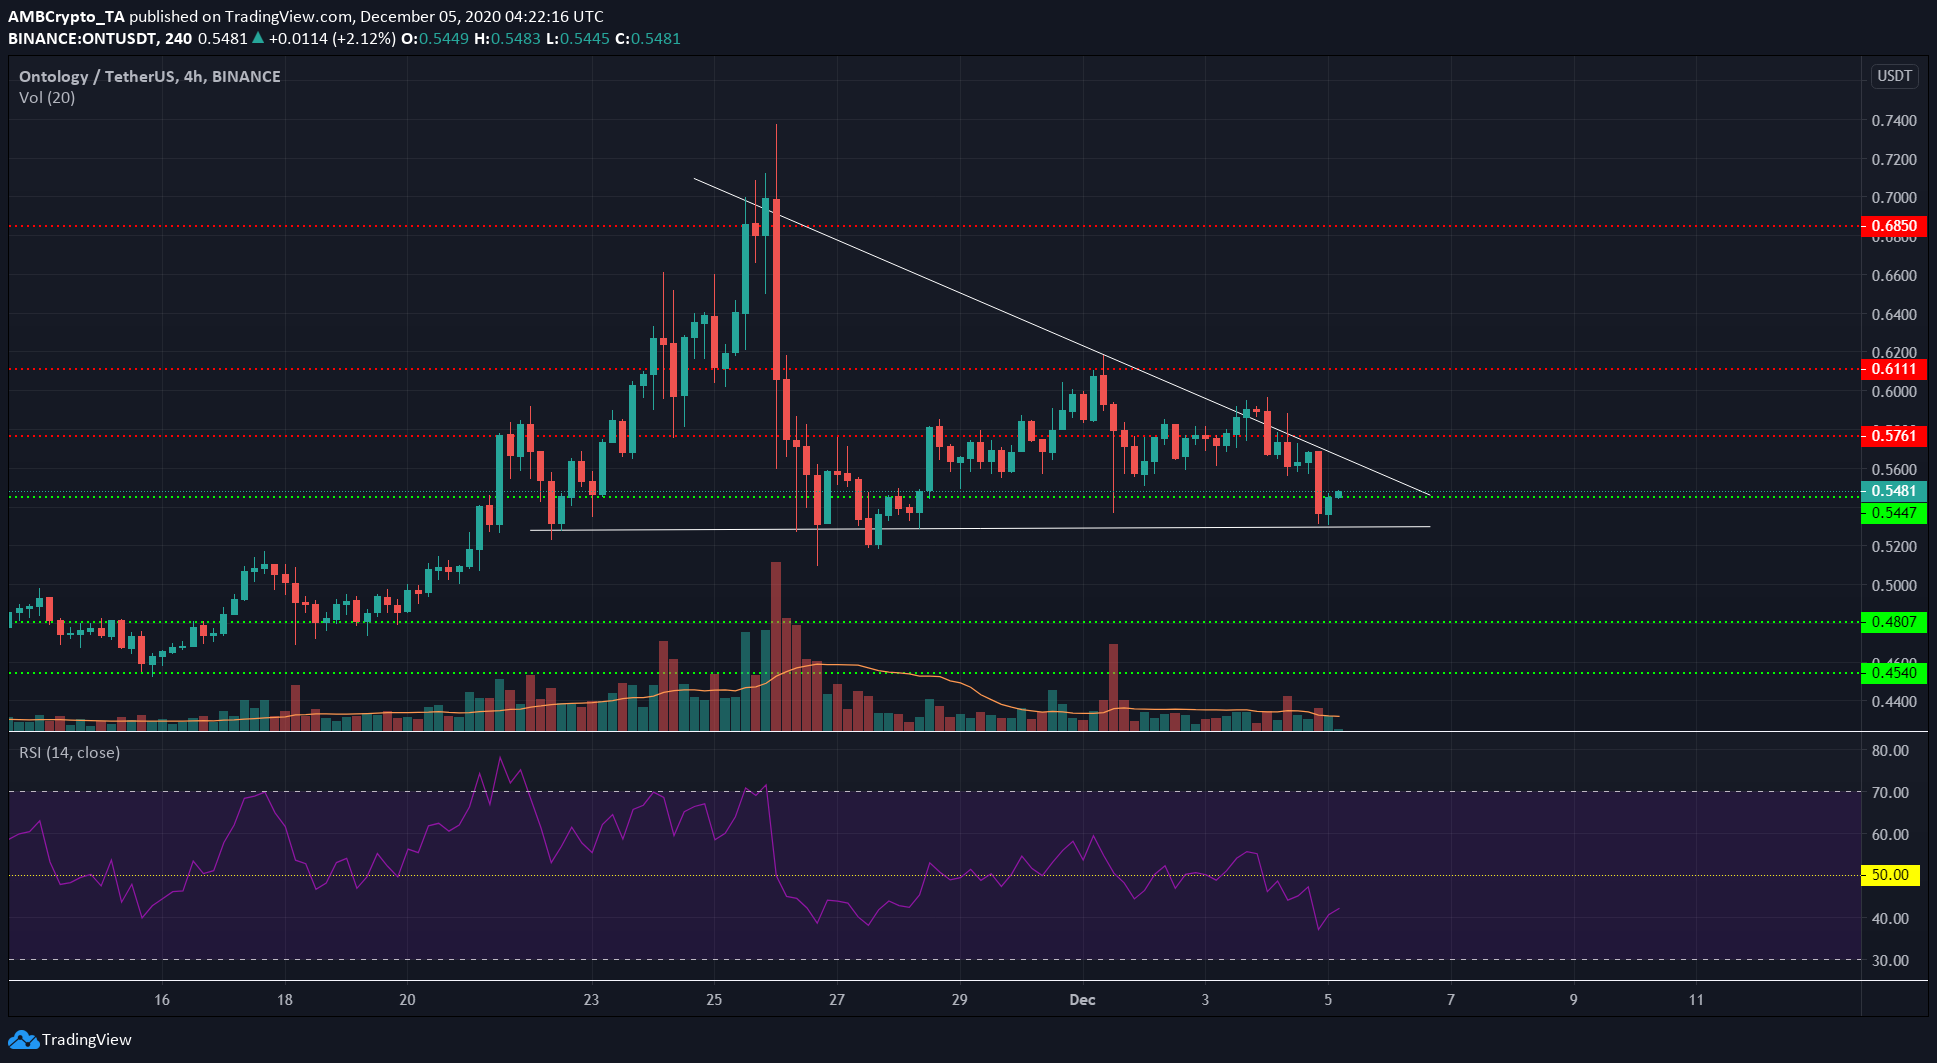
Source: ONT/USDT on TradingView
ONT formed a descending triangle. This pattern indicated an imminent breakout with confirmation yet to be made. Trading volume has also been decreasing and would pick up upon a close outside the trendlines.
The RSI showed bearish momentum and a downtrend in progress over the past few days. The region at $0.54 has served as strong support, yet it could be flipped to resistance upon a close below $0.5.
Sometimes the descending triangle sees a fake move to the downside before a powerful reversal, hence traders must carefully manage stop-loss orders with ONT if trading this pattern.
Enjin [ENJ]
Source: ENJ/USDT on TradingView
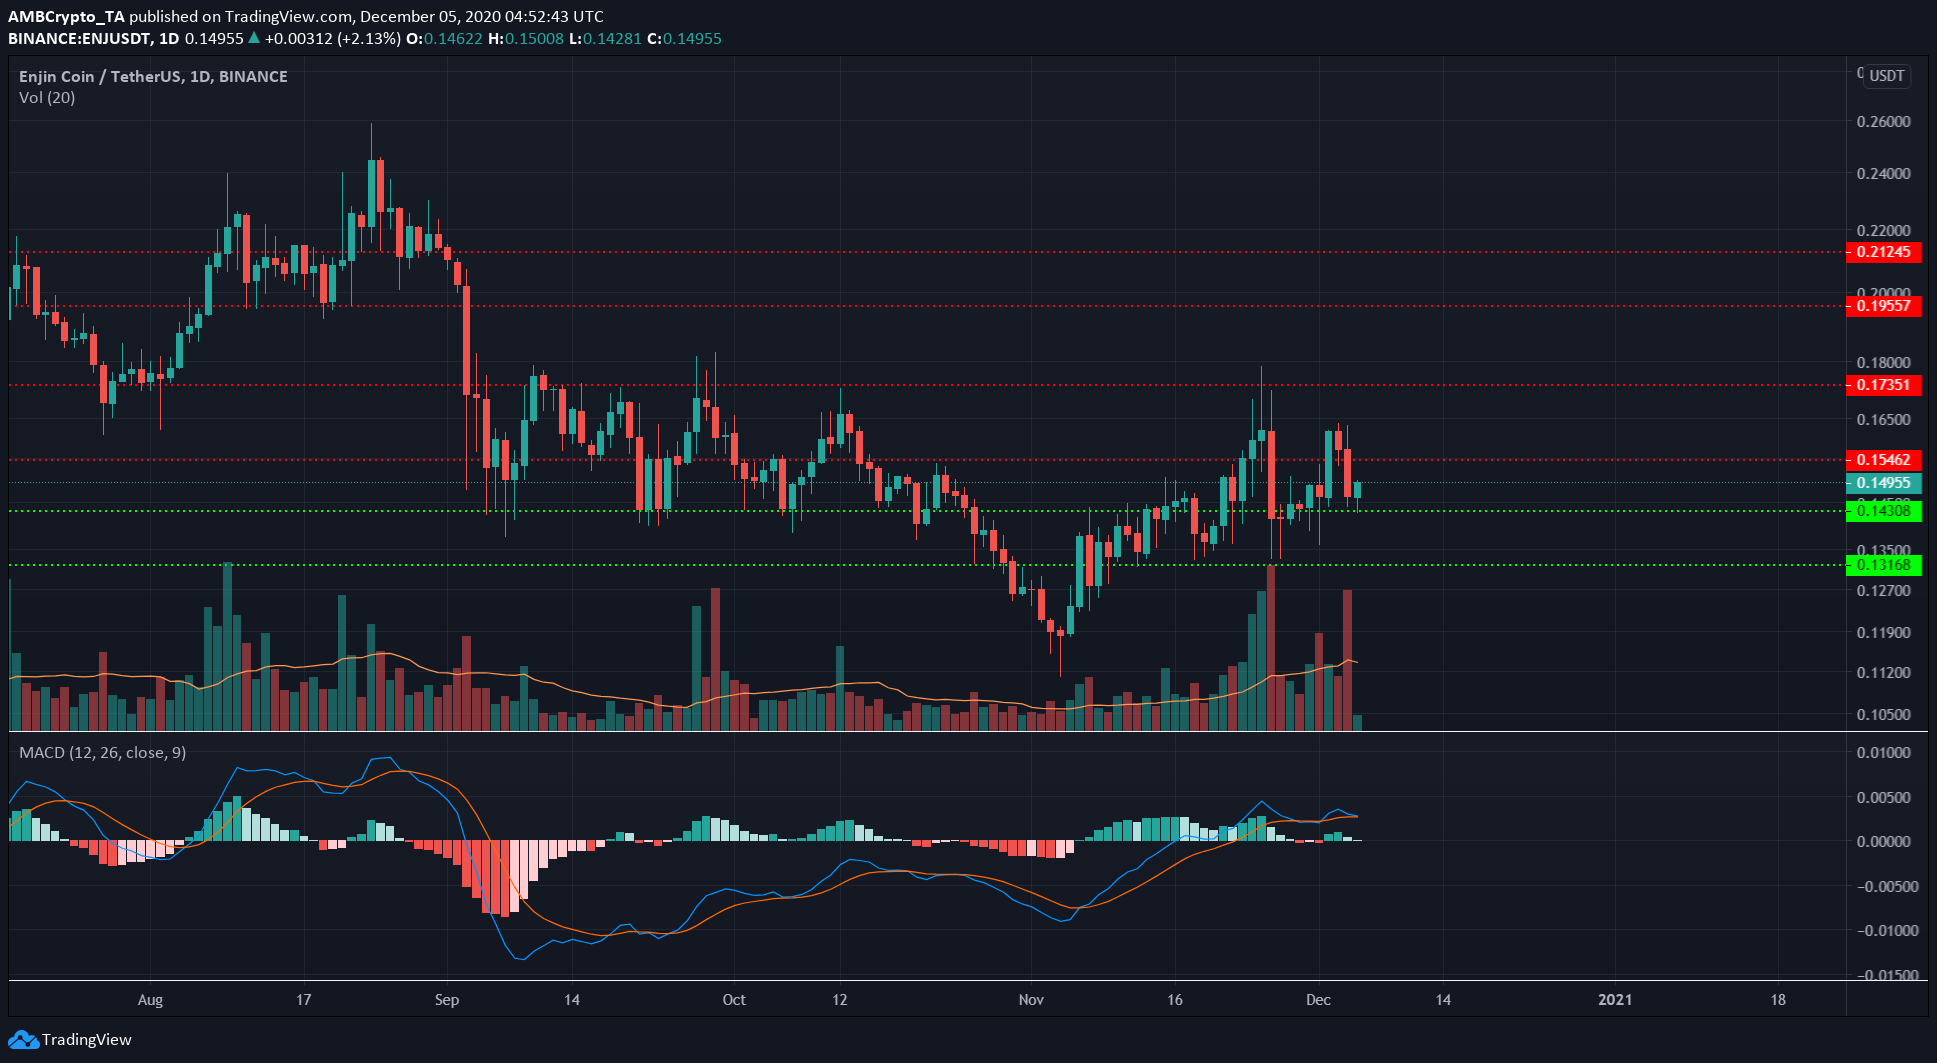
The daily chart for ENJ highlighted two important levels of resistance and support for ENJ. Since September, the level of resistance at $0.173 has not been conquered by the bulls despite multiple attempts on strong volume.
In the same time period, the support at $0.143 has held steady for the most part. The loss of this level saw ENJ dip to $0.112. Above $0.143, $0.16 level can be used as take-profit for long positions.
The MACD was above the zero line, in response to ENJ’s recovery from $0.112. The aforementioned levels can be used to execute swing trades. A daily close below $0.143 could spell trouble for bulls.