
Bitcoin fell after breaching its ATH and this volatility caused many altcoins to drop on the charts. Litecoin had a bullish short to medium-term outlook but appeared to form a bearish reversal pattern on the daily timeframe. Cosmos appeared to be headed toward $5 support once more, and Zcash also sought a level of support in the face of recent selling pressure.
Litecoin [LTC]
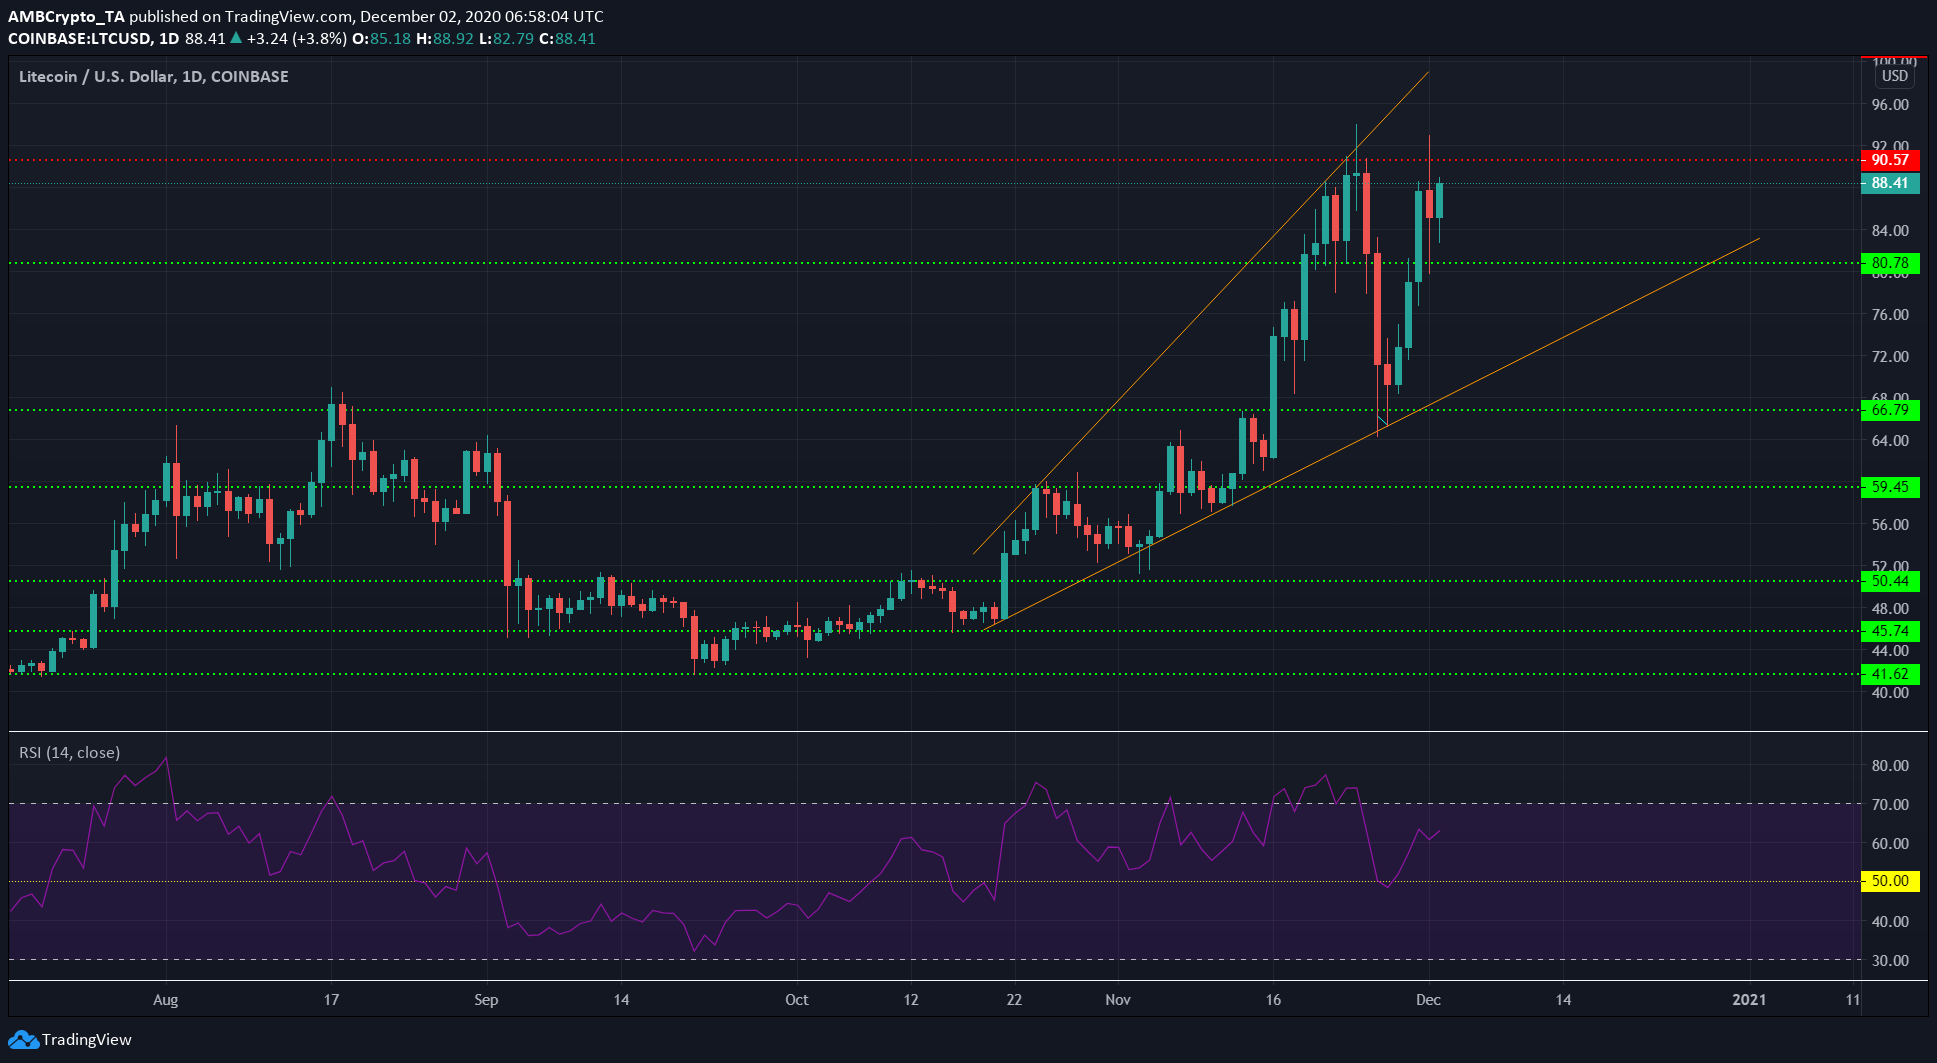
Source: LTC/USD on TradingView
On the daily timeframe, Litecoin has registered impressive gains. The RSI showed bullish momentum and a clear uptrend was in play.
Yet, an ascending broadening wedge was being formed. This could take many more days to either play out or be invalidated, however, it is a pattern that could signal a bearish reversal for LTC from a long-term perspective.
The level at $90 was the closest level of resistance, and beyond it, the wedge’s upper trendline coincides with the $100 level of resistance.
Cosmos [ATOM]
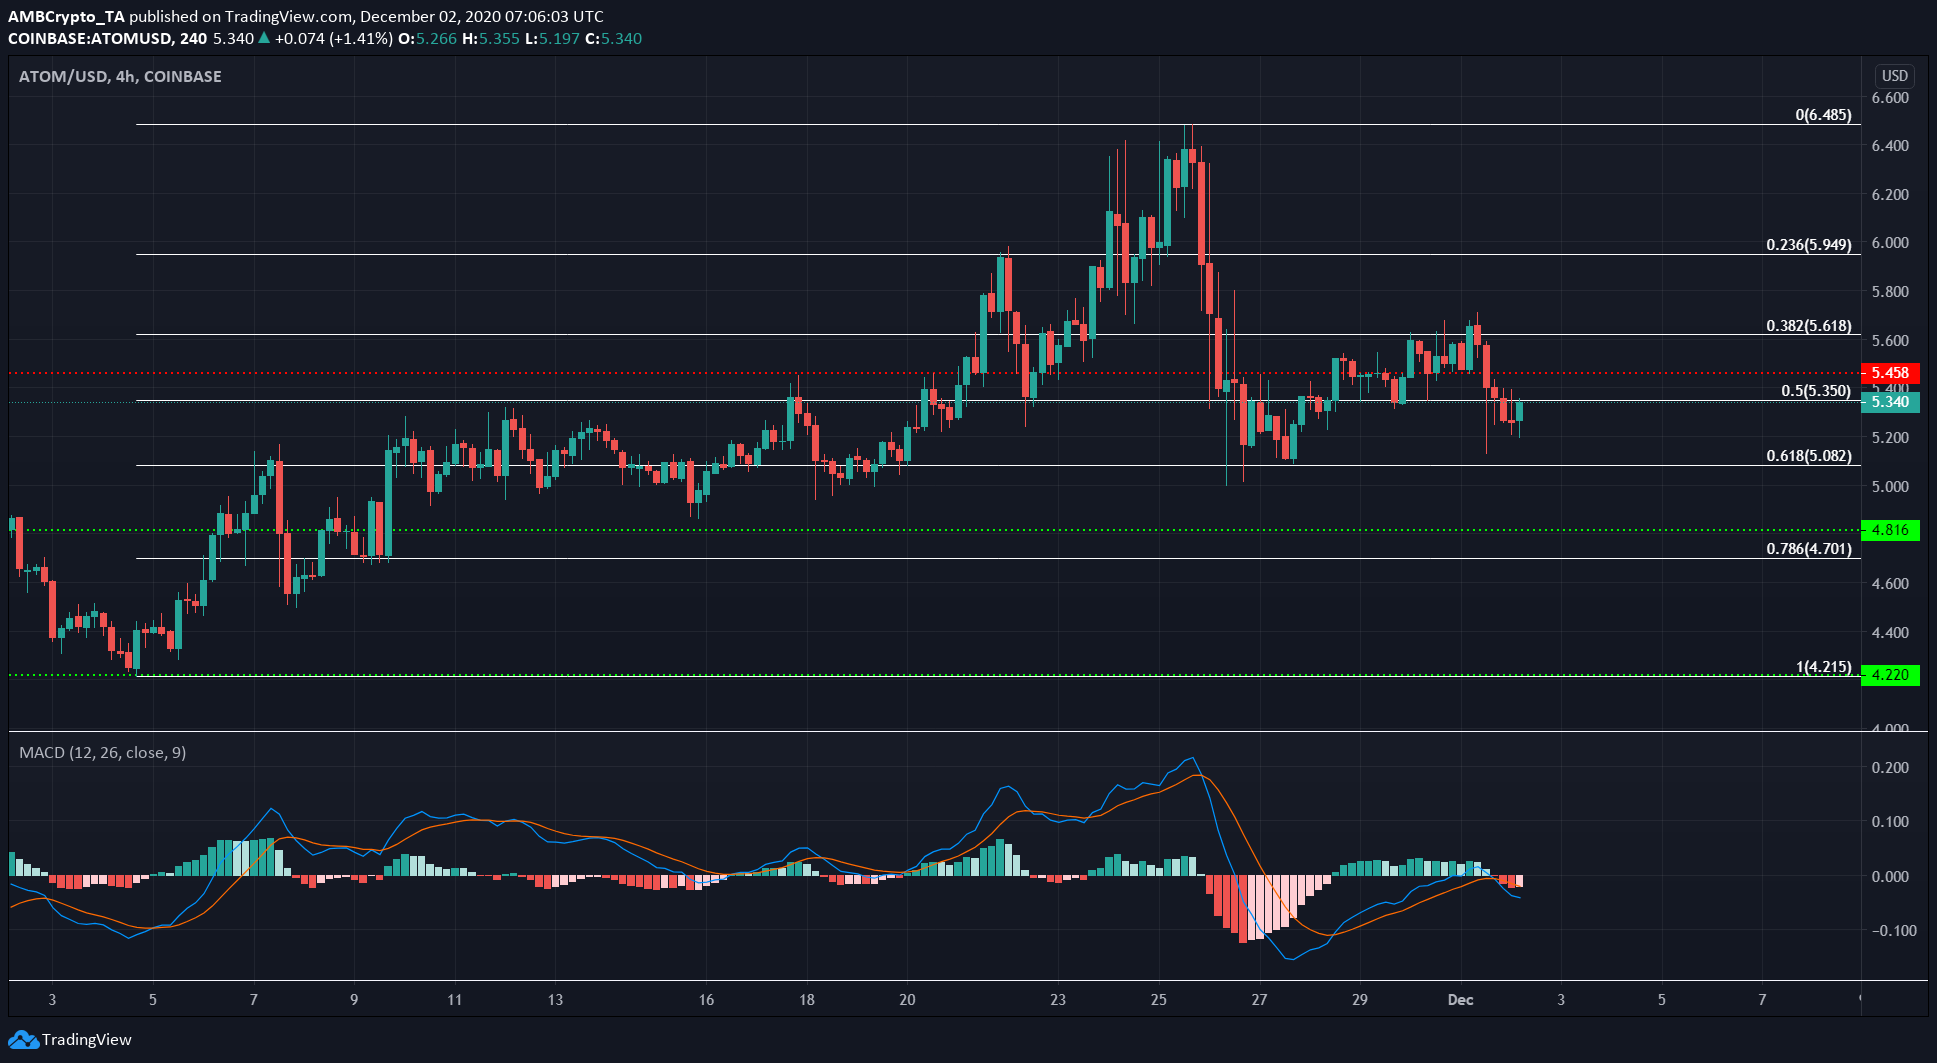
Source: ATOM/USD on TradingView
Using the Fibonacci Retracement tool for ATOM’s move from swing low $4.21 to swing high $6.48, some important levels of retracement are highlighted.
ATOM in its most recent trading session opened beneath the 50% level at $5.35 and attempted to climb past. However, the MACD showed bearish momentum.
A bearish crossover beneath the zero line showed a strong sell signal, and ATOM could be headed down to $5 in the coming days.
Zcash [ZEC]
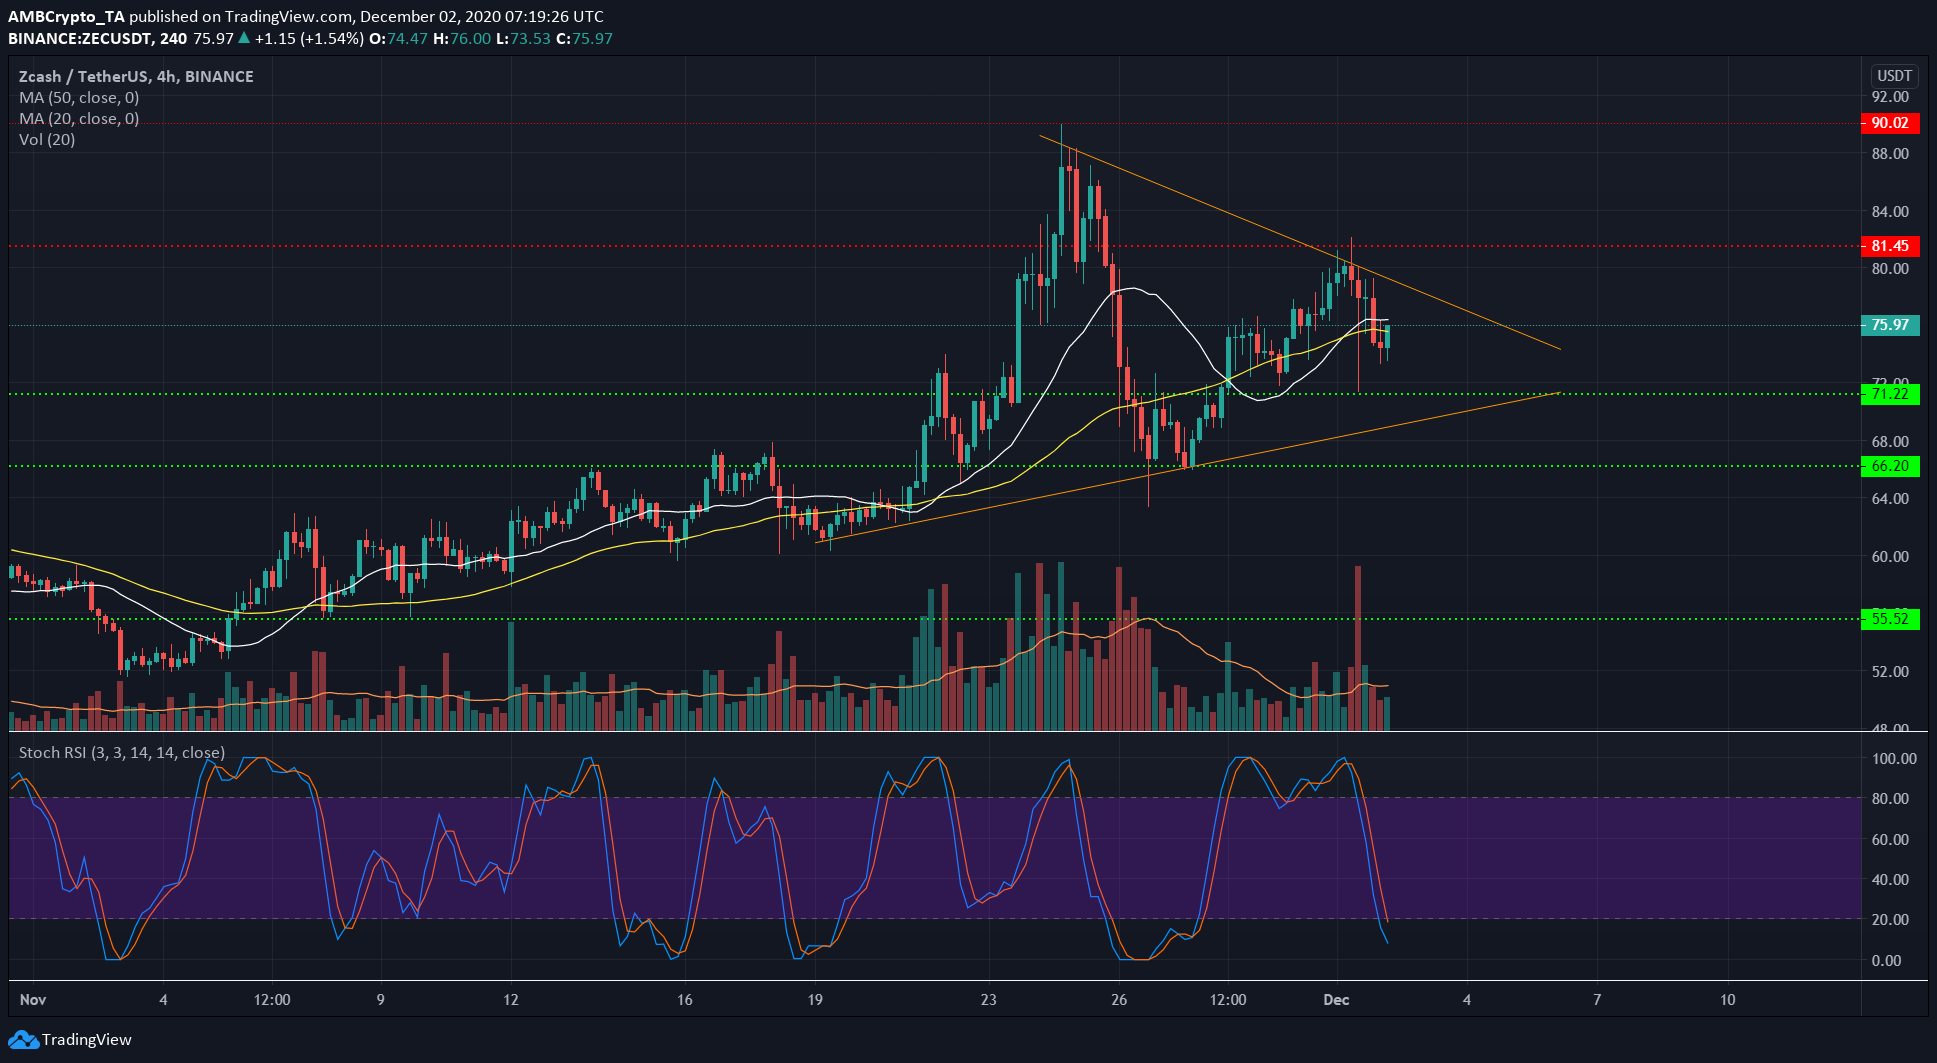
Source: ZEC/USDT on TradingView
ZEC formed a symmetrical triangle, and the imminent support for ZEC was at $71 and resistance in the vicinity of $78 from the descending trendline of the pattern.
Trading volume had been on the decline but for a session that saw bulls valiantly fight back to drive ZEC upward after a wick down near $71. However, the selling pressure forced the price lower in subsequent sessions.
The Stochastic RSI was in the oversold region and it was possible that ZEC could rise toward $78. Yet, the past few hours saw the price close beneath the 50 SMA (yellow), hence a move to $71 might be more likely for ZEC.
Being a continuation pattern, the triangle pointed toward a breakout to the upside from the $71 level for ZEC in the coming week.
![Reasons why Litecoin [LTC] investors should be concerned](https://engamb.b-cdn.net/wp-content/uploads/2023/12/ambcrypto_A_Litecoin-themed_scen-400x240.png.webp)