
With Bitcoin seemingly consolidating just below the $13,000-level, buying momentum for most alts has also subsided over the weekend.
In fact, technical indicators for NEM and VeChain turned neutral from bullish as some selling pressure started to creep into the market. Cardano too seemed to lose bullish momentum as it faced rejection at a key level of resistance on the charts.
Cardano [ADA]
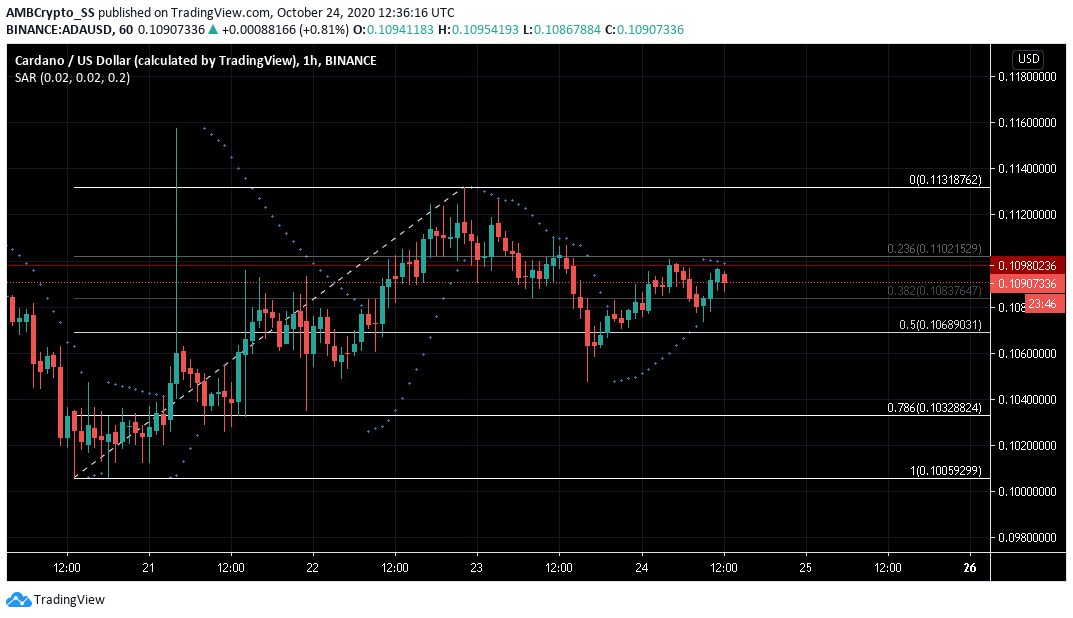
Source: ADA/USD on TradingView
Over the past 24-hours, Cardano (ADA) had mostly maintained its prices above the 50% retracement level, as marked by the Fibonacci retracement tool.
But, at press time, ADA was registering a drop below the $0.109-level of resistance due to underlying selling pressure. Further, the dotted markers of the Parabolic SAR were above the price candles and hinted at a downtrend.
Even though a downtrend seemed to be visible from observing the technical indicators, the price could also be seen experiencing a pullback just above the 50% retracement region or the $0.106-mark.
NEM [XEM]
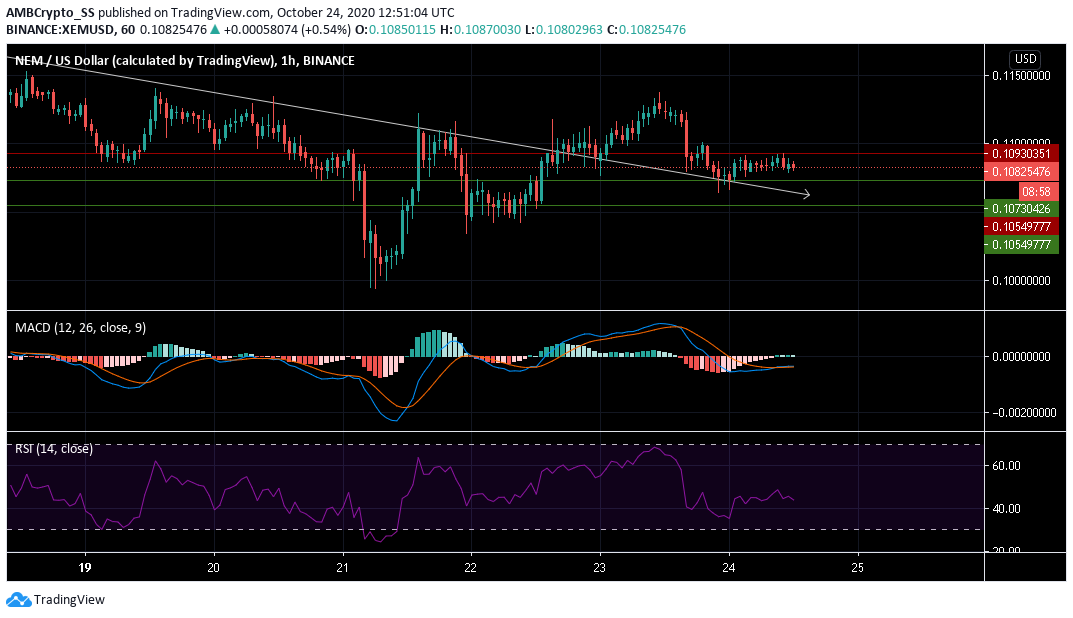
Source: XEM/USD on TradingView
NEM continued to be under selling pressure, while maintaining an overall downtrend. The digital asset lost control of a key resistance level, one that resulted in a 3.5% loss over the last 24-hours.
On the other hand, the convoluted MACD lines remained neutral, although hints of a bullish crossover were starting to emerge.
The Relative Strength Index for NEM was still indicative of selling pressure, but a pattern of higher lows in the upcoming week could confirm the possibility of a trend reversal from bearish to bullish.
However, for the immediate trading sessions, NEM’s market shall continue to be under selling pressure with strong support zones existing at the $0.105-level.
VeChain [VET]
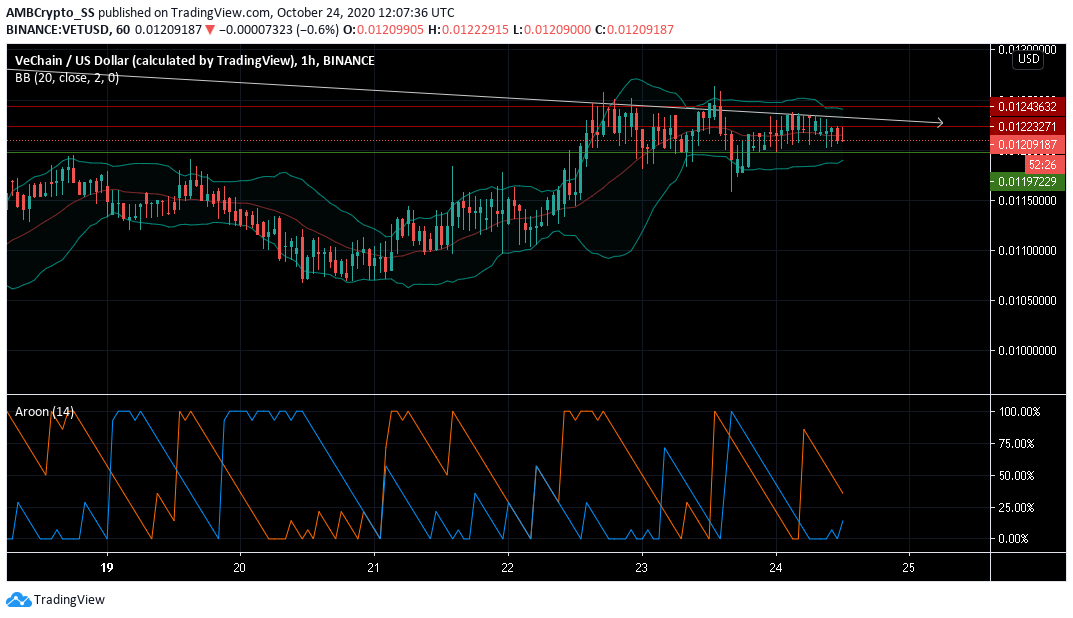
Source: VET/USD on TradingView
At the time of writing, it seemed like VeChain’s bulls may have entered a period of calm, with the prices noting horizontal movement over the last 48 hours.
The Aroon Indicator, only slightly bullish, might soon confirm a neutral position as the prices seem to also stabilize just above the $0.0119-level of support.
In fact, an immediate price action in either direction may take a few more trading sessions due to unchanged volatility levels, as observed by the Bollinger Bands.
A price oscillation along the median band and between the immediate support and resistance levels may continue throughout the weekend.