
Bitcoin shot past $12k and was trading at $12,239 at press time. Crypto Fear and Greed Index stood at 61, indicating growing greed in the market. Bitcoin Dominance rose to 61.75, as Ethereum posted gains and approached a strong level of resistance. Selling pressure did not relent on Tron while Basic Attention Token showed a bullish divergence.
Ethereum [ETH]
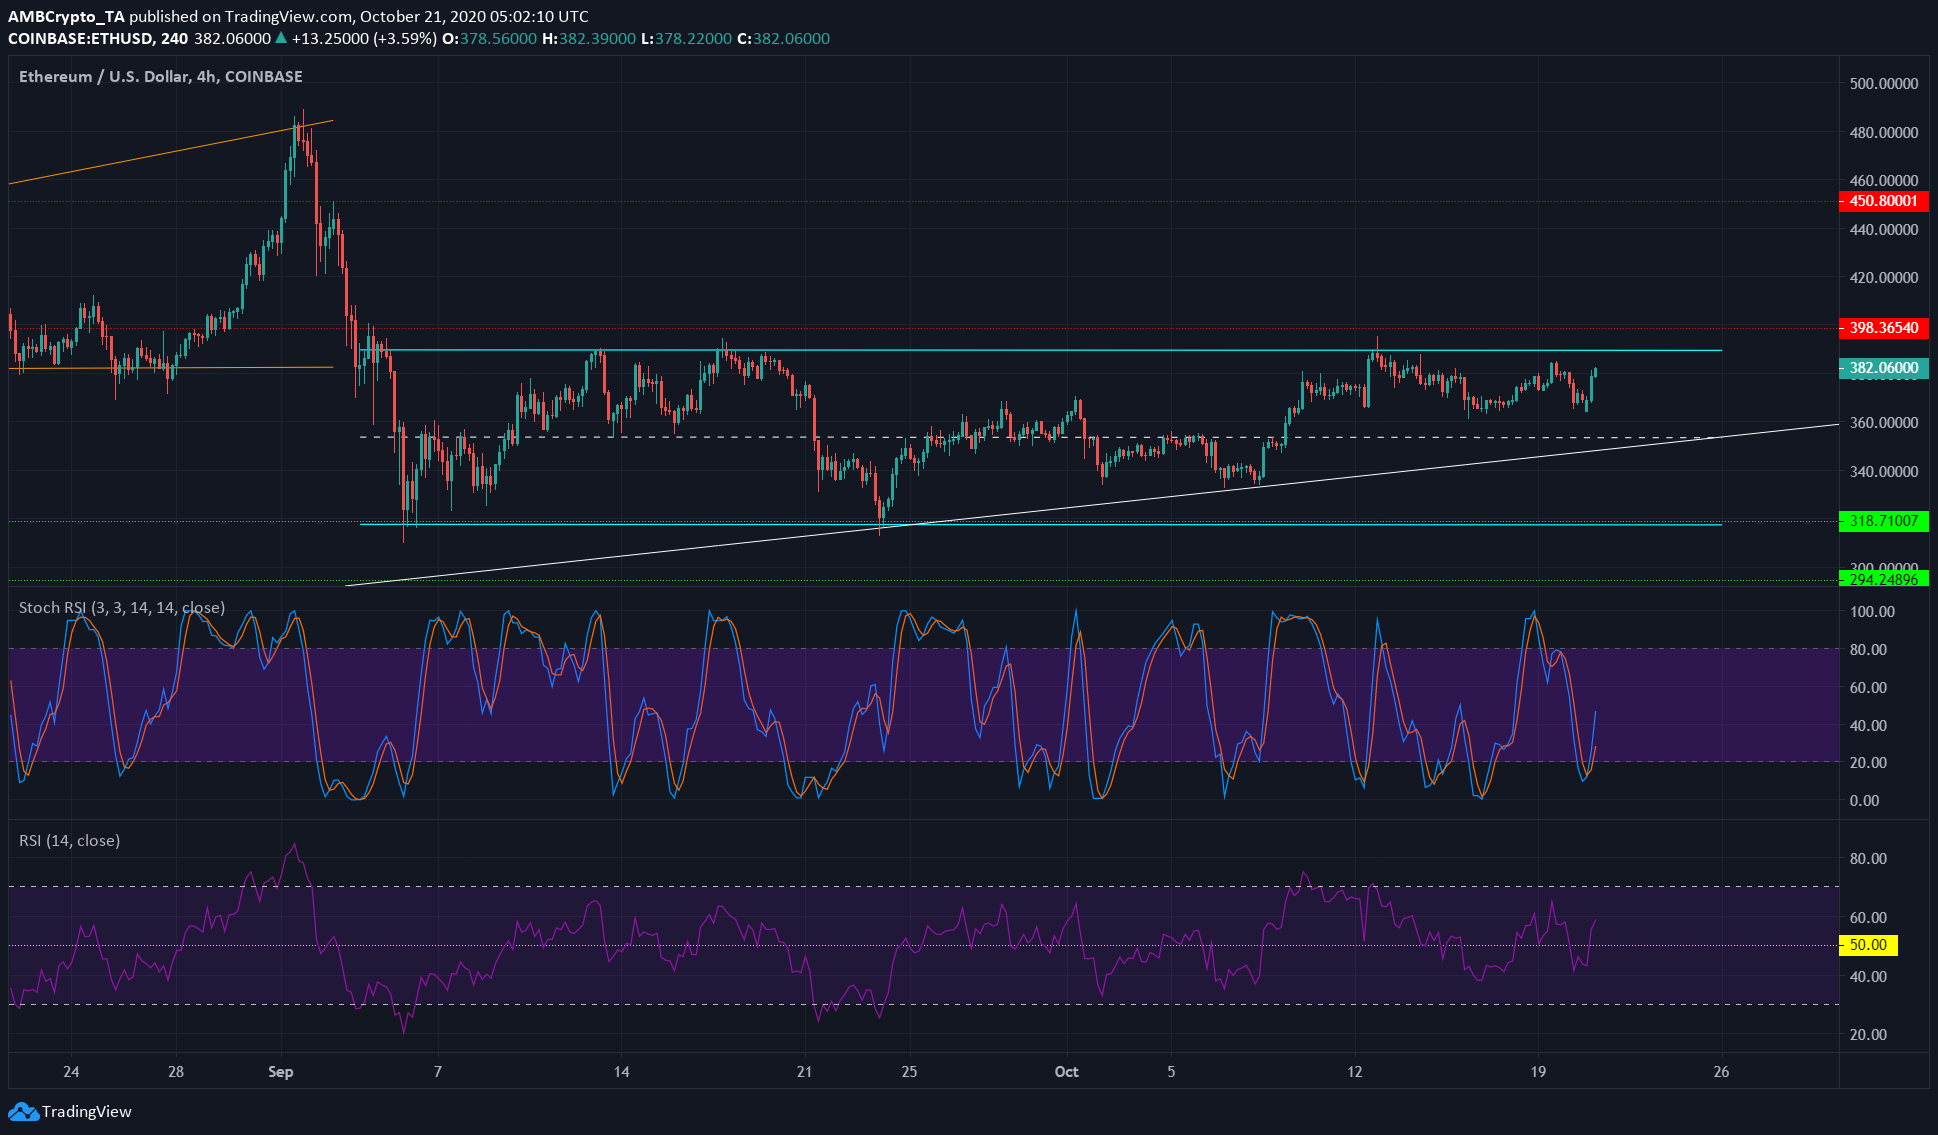
Source: ETH/USD on TradingView
In white is the ascending trendline from March that captures Ethereum’s uptrend since Black Thursday. A rectangle bottom formation is highlighted in cyan.
Ethereum has traded above the rectangle’s midpoint at $360 for the past couple of weeks as it gathered steam to breach the region of resistance at $380.
The RSI was at 58, indicating recent bullish momentum for the asset while the Stochastic RSI was also climbing.
Any dips can expect to find a strong support near $360, while a close above $384 will signal a possible move beyond $400. This could quickly take the asset’s price toward $500.
In other news, Ethereum 2.0 hype might be a bit early as the launch was delayed multiple times, most recently due to hiccups in the scalability aspect.
Tron [TRX]
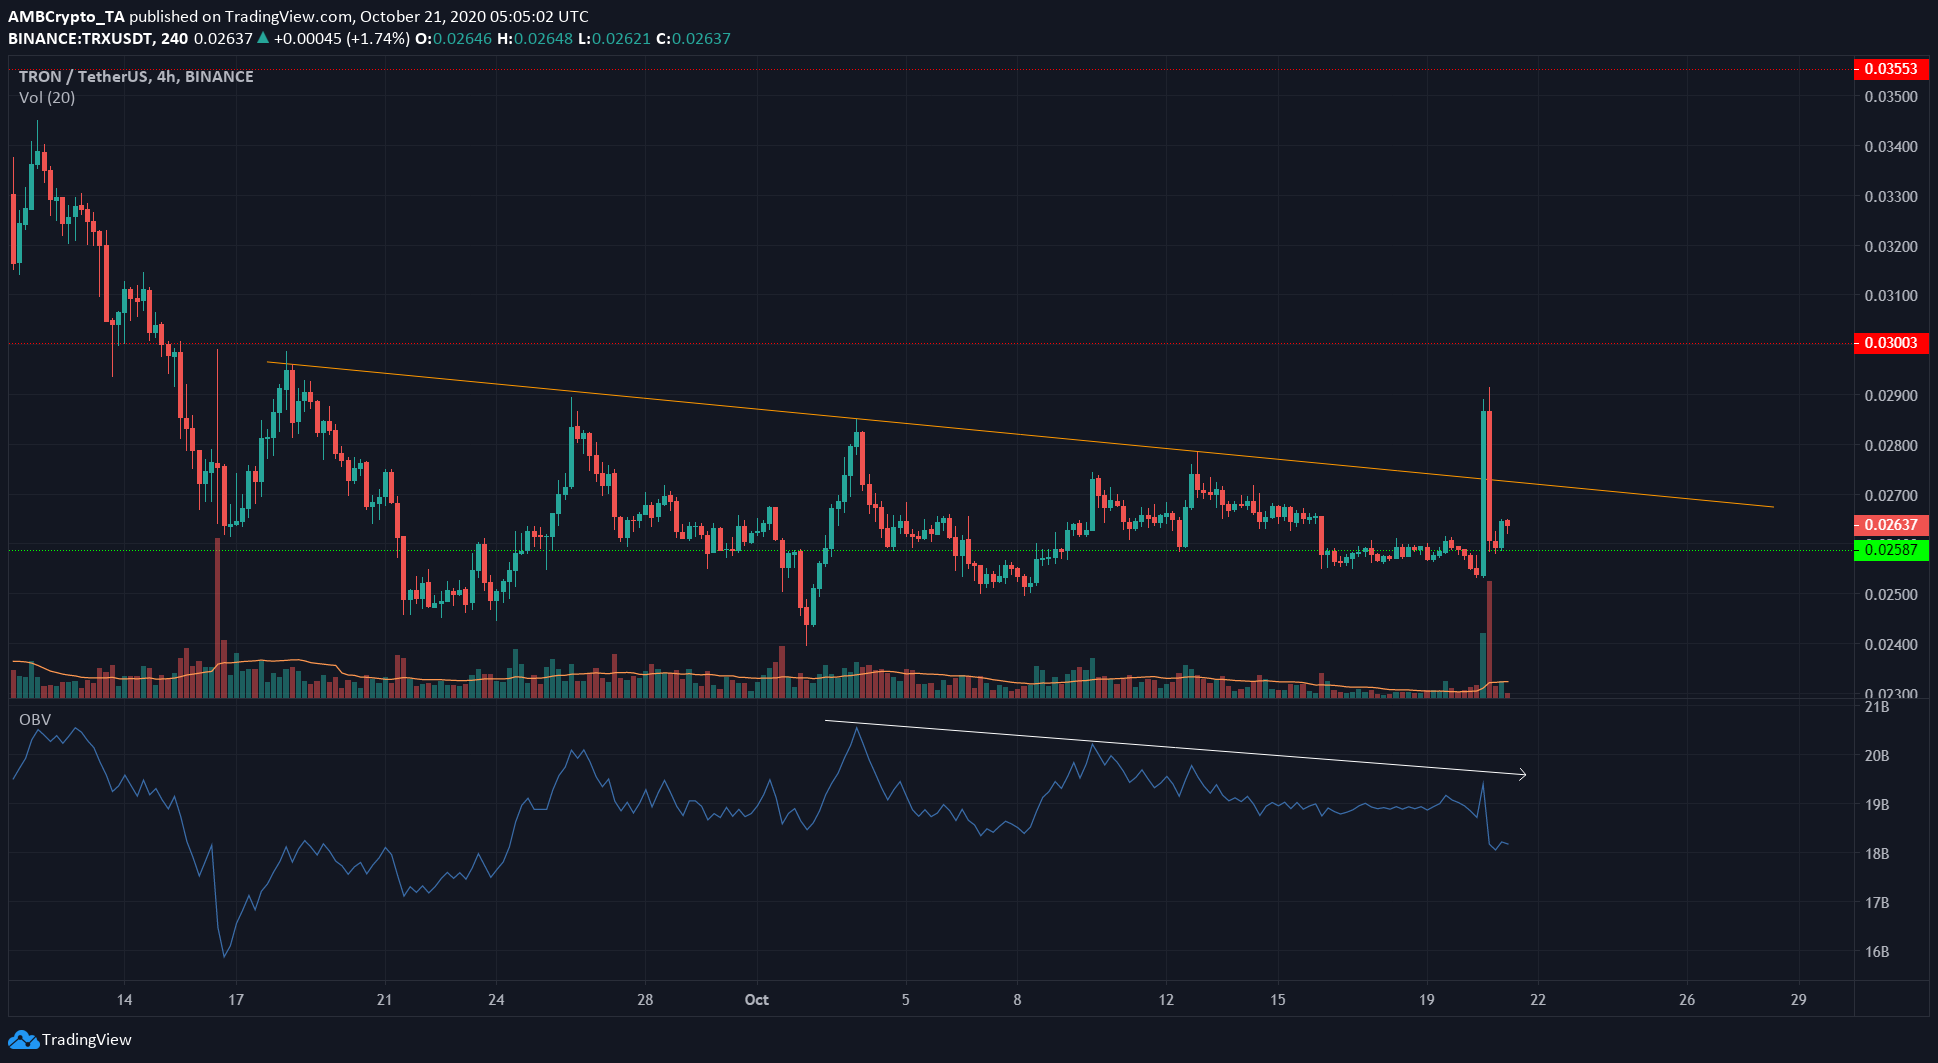
Source: TRX/USDT on TradingView
The past month’s lower highs are captured by the descending trendline (orange). TRX appeared to bounce explosively off $0.258 support past trendline resistance, as seen by the high trading volume for that session.
Yet the selling pressure was even more voluminous and TRX was brought back to the same level of support.
The OBV also agreed with TRX price movements, as buyer interest waned in the past few weeks.
It was likely that TRX would lose $0.258 as support in the coming days.
Basic Attention Token [BAT]
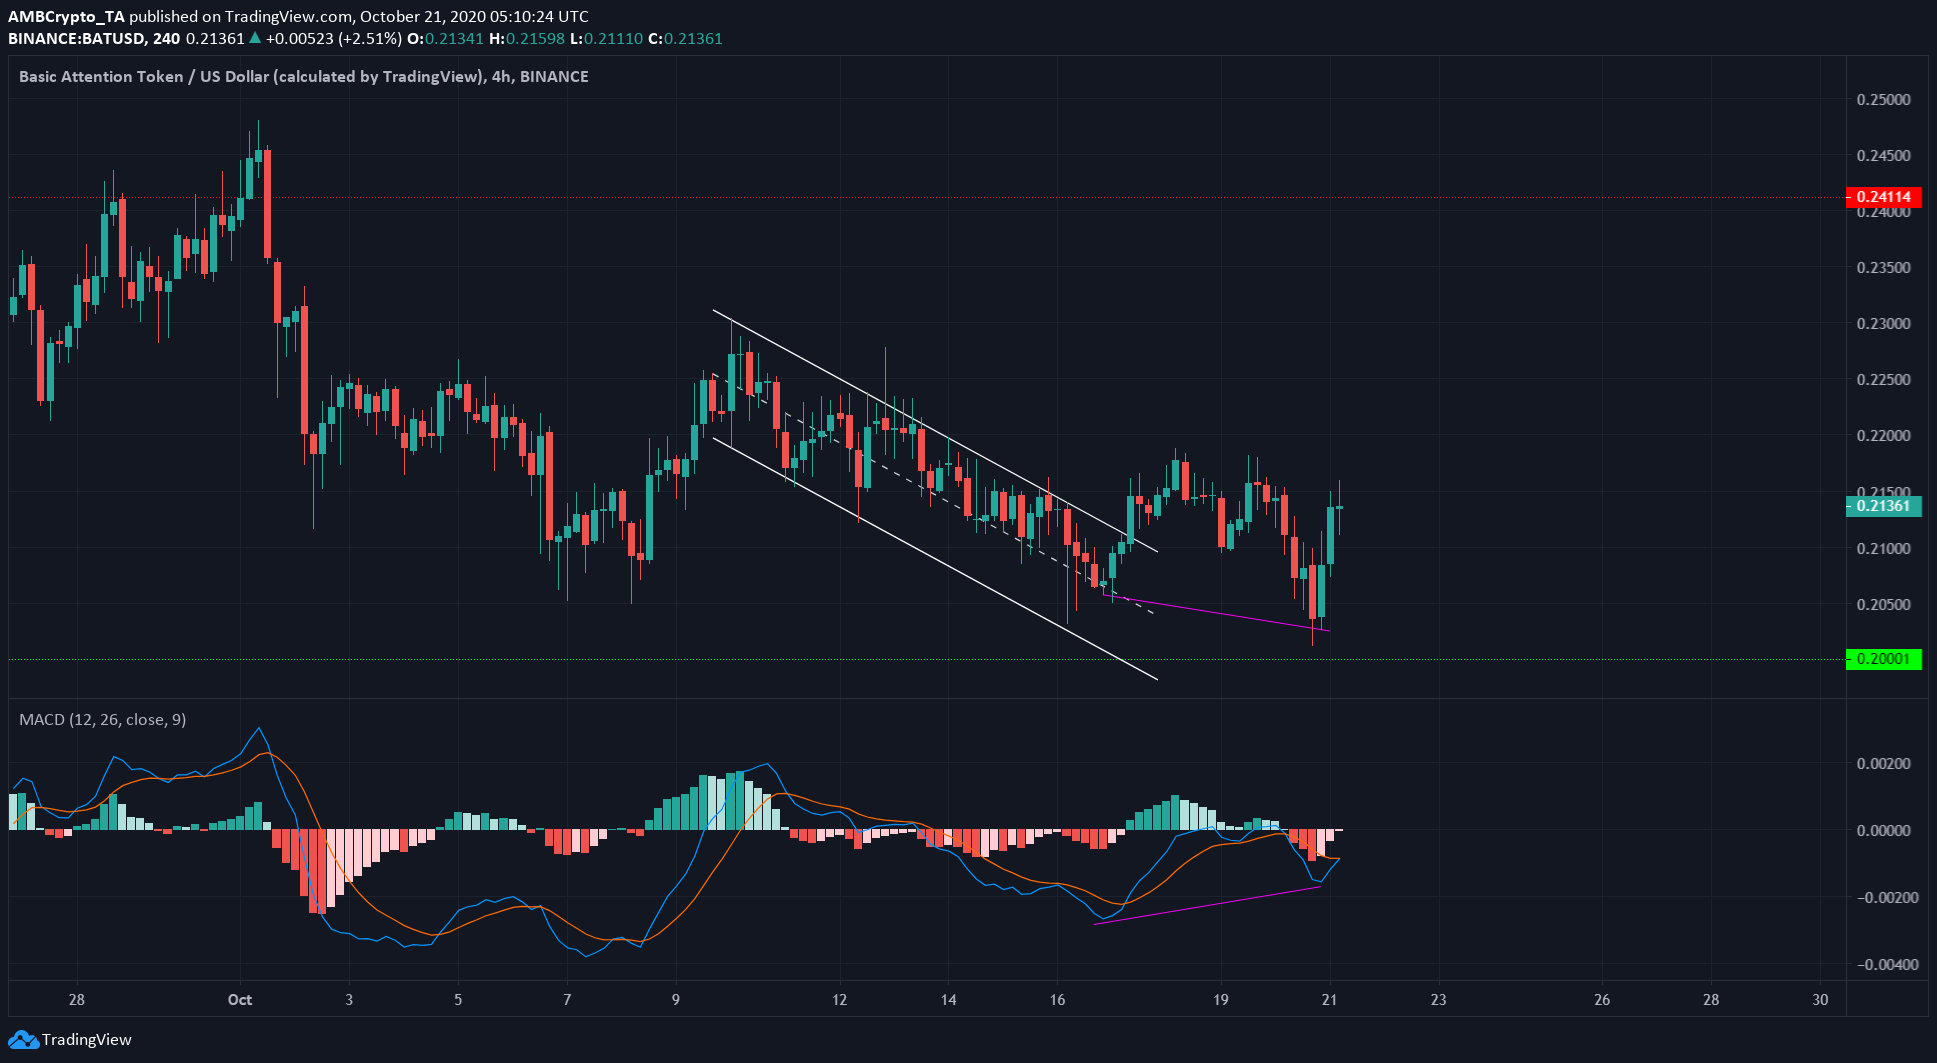
Source: BAT/USD on TradingView
Basic Attention Token broke out of a descending channel but was unable to close above $0.215.
However, there was a bullish divergence seen (pink) when the price made a lower low, and the momentum indicator (MACD) formed a higher low.
Subsequently, BAT surged, but the most recent candle showing indecisiveness in the market. Failure to close above $0.215 in the next few sessions would be bearish for the asset.