Ethereum’s long-term outlook seemed bearish, at the time of writing. In fact, the price might drop by 20-30% as this bearish pattern develops on the charts. Interestingly, this might coincide with Bitcoin’s movements as well.
Here, it should be noted, however, that this is all happening on a weekly time frame, and hence, it could be months before Ethereum’s price actually breaks out of the pattern.
Ethereum weekly chart
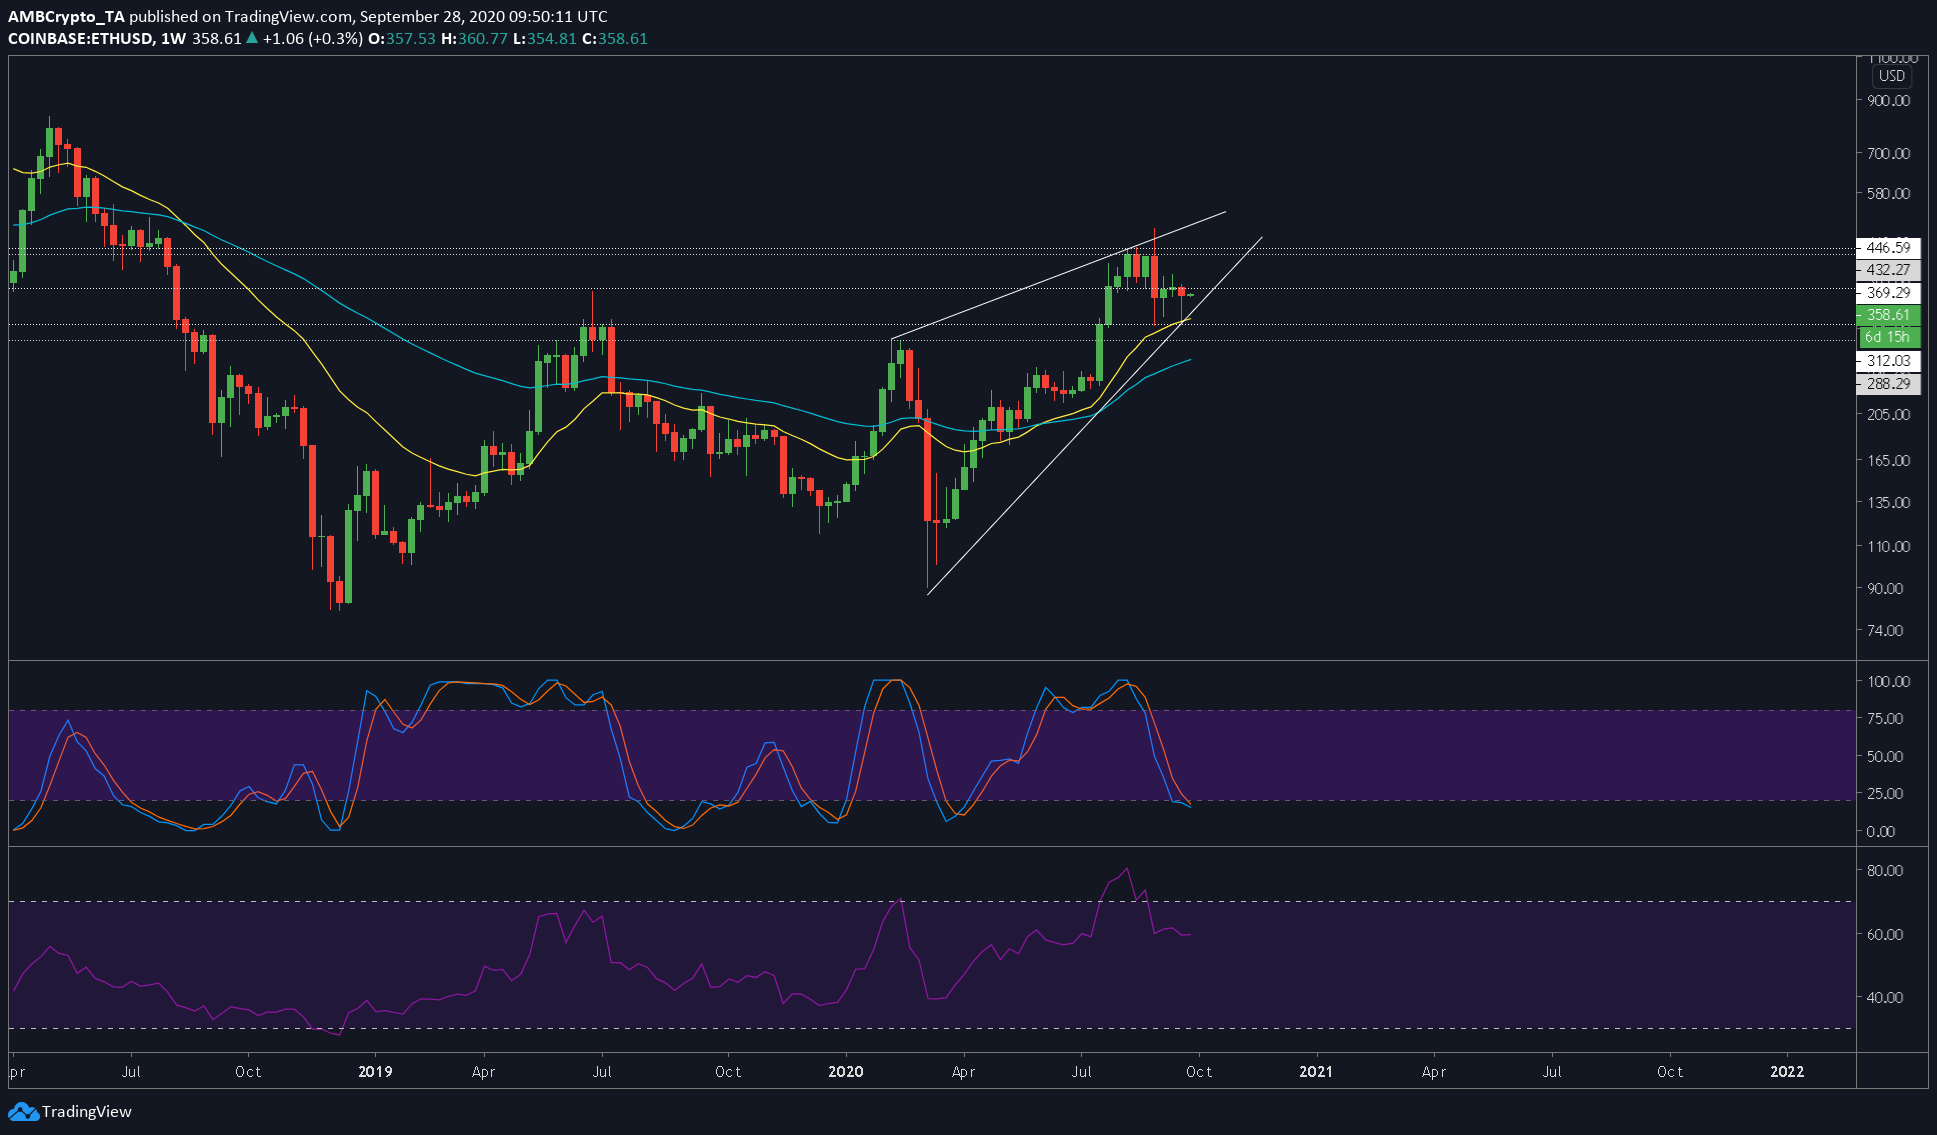
Source: ETHUSD on TradingView
The rising wedge is a bearish pattern and has an obvious breakout towards the bottom. However, since the said pattern formed on the weekly time frame, the breakout, should it go to the full extent, will be devastating. Perhaps, this might, as mentioned, coincide with Bitcoin filling the CME gap. Additionally, Bitcoin too formed a similar rising wedge pattern on the daily timeframe.
Although ETH has a long way to go before it breaks out, the implications are bearish nonetheless. At press time, the price seemed to have finished its bout with the bottom of the wedge and was hinting at heading higher. However, it could also re-test the bottom of the wedge again.
After its re-test, if any, the price will be bullish and might surge about 15-20% until it hits $445. Hereon, the price will be heading towards the breakout, with targets at $432, $369, $312, and $288. If the selling pressure continues, ETH might even wick down to $263.
The $312-level coincides with the 20-Week moving average [Yellow], a bounce from here corresponds to a healthy uptick. The opposite, however, would be disastrous as the price rarely dips below the 20 WMA in a bull market.
If the 20 WMA fails, then the last line of defense will be the 50-Week moving average [blue] at $263.
Ultimately, ETH is expected to head 20% higher from the press time price, before dropping ~40% from the peak. The bullish scenario was supported by the Stochastic RSI which hinted at a potential bullish crossover soon.
Likewise, the RSI indicator seemed to be finding support at the 57-level, which will help ETH’s bullish case.