Disclaimer: The following price prediction should not be considered as investment advice.
While the majority of the altcoins always follow Bitcoin’s market trail, some of them have lately followed their own path. Chainlink is a prime example. For a brief window, Tron was performing really well on its own and lately, it has been Binance Coin. When the market declined last week, Binance Coin was one of the altcoins that held its own in the space for a while, but then it folded as selling pressure increased across the digital asset space. However, the recent analysis looked upon the possibility of a recovery over the next few days.
Binance Coin 6-hour chart
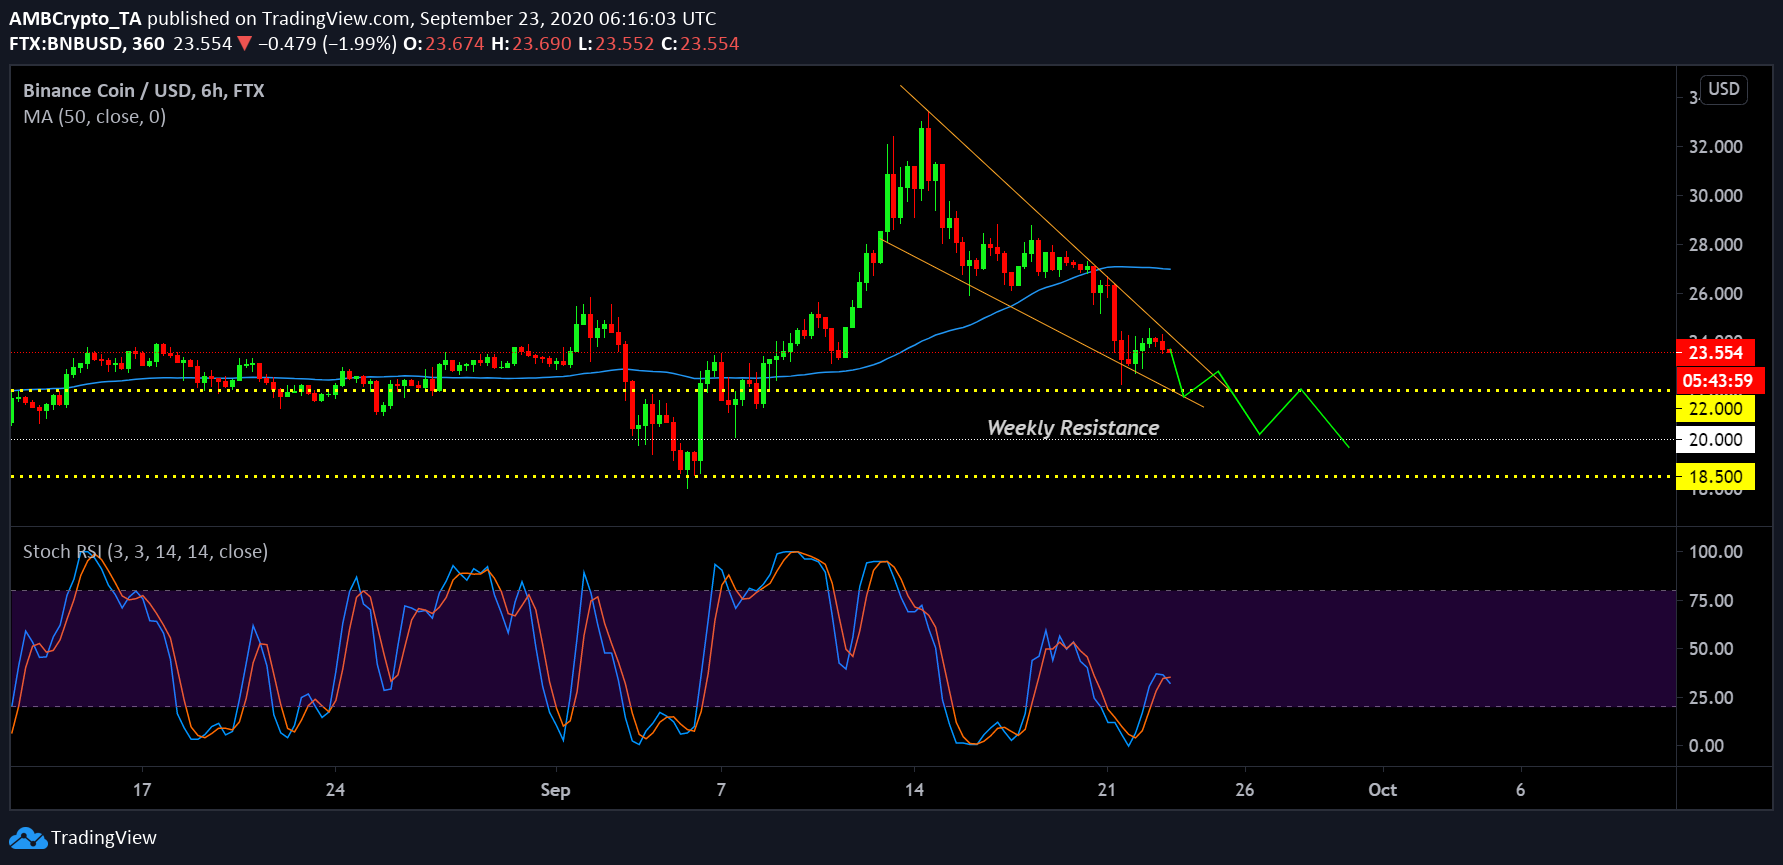
Source: BNB/USD on Trading View
Although Binance Coin was holding a high line in terms of value during the first two weeks of September, the larger picture suggested that the decline started right around the 14th of September. While the asset tried to recover, its oscillation within a falling wedge restricted its movement. It re-tested the upper declining trend line thrice over the past week. Now, consolidating right above its support at $22, a further pullback period would see the token re-test the lower range.
The green line can be taken as a point of reference for predicted movement, but the weekly support at $20 should hold. The last support lies at $18.5 and any position below this range can dismiss the long-term bullish trend. Stochastic RSI suggested a minor bearish crossover hence, a re-test at $20 could be the next target.
Binance Coin 1-day chart
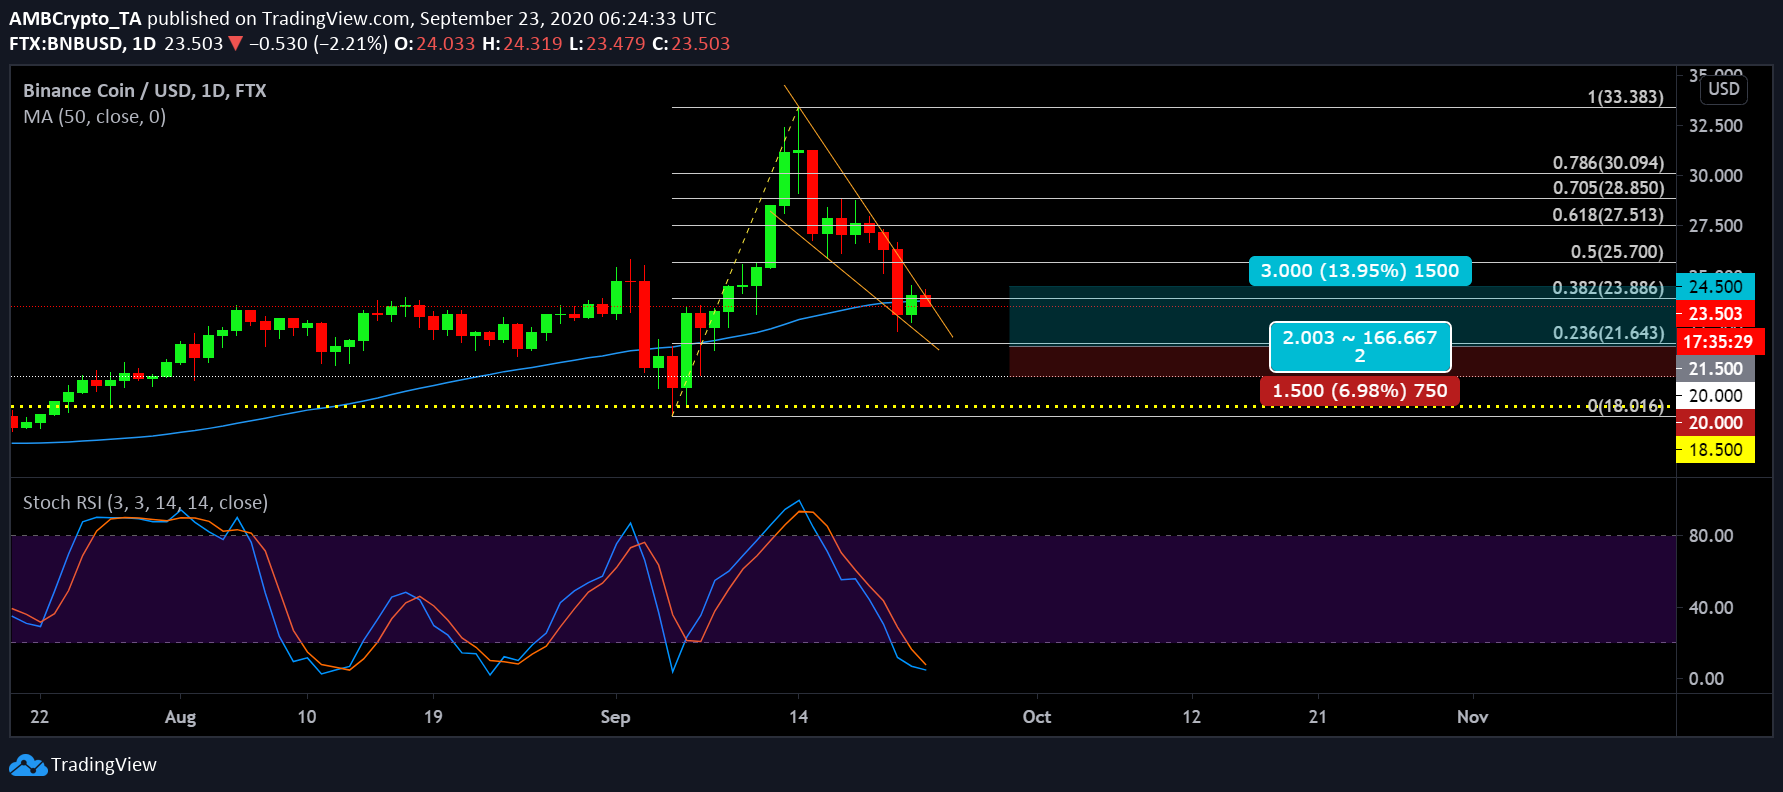
Source: BNB/USD on Trading View
If the one-day chart is observed, all the signs indicate an imminent recovery at the moment. The price is consolidating near the 50-Moving Average but according to Fibonacci retracements, $21.5 will possibly be tested. This could be a good entry for a long-position but the profits should be taken at $24.5, without being too greedy. With a stop loss at $20, a Risk/ Reward ratio of 2x is obtained.
The Stochastic RSI is currently placed at the over-sold position with a higher emphasis on a bearish trend but it is very close to a bullish crossover as the blue line closed down the distance. If the bullish crossover is completed within the next 24-hours, the price will rise quickly in the following few days.