
Disclaimer: The following price prediction should not be taken as investment advice as it is the sole opinion of the writer. The prediction should materialize in the next 24-48 hours.
While Ethereum’s effort to hold fort near $390 is commendable, it would be inaccurate to state that the industry did not see this coming. With Bitcoin over-bought and barely holding a high value a few days back, Ethereum was primed to follow on BTC’s cue, whenever the king coin would collapse. The plot played out as expected with Ethereum depreciation below its support at $360.
Ethereum 1-day chart
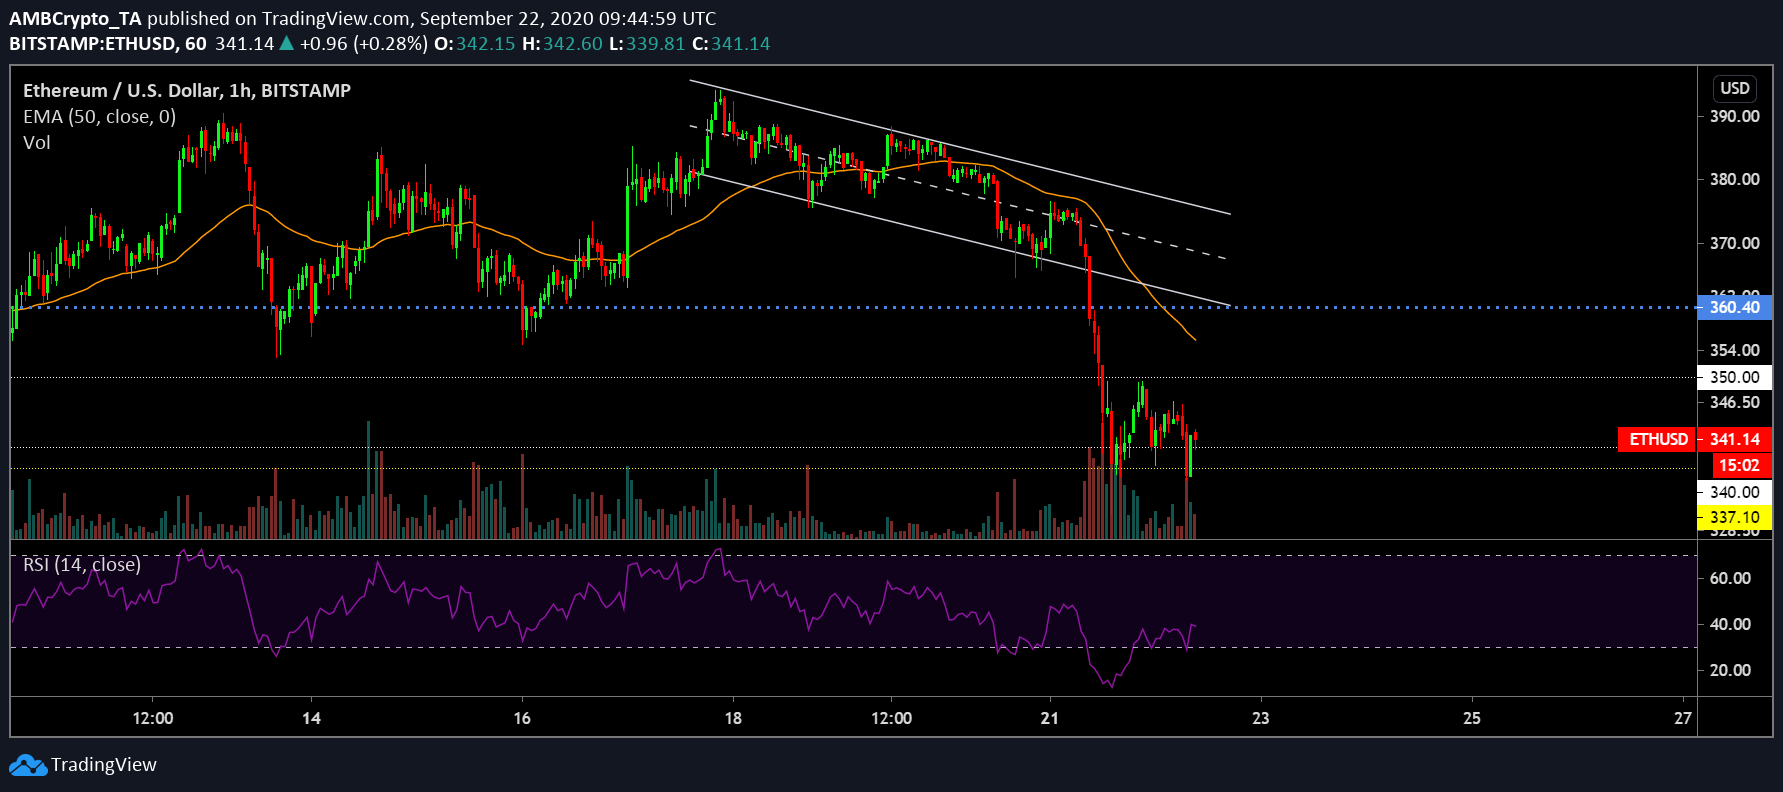
Source: ETH/USD on Trading View
Although Ethereum’s 1-hour chart exhibited the formation of a descending channel carrying bullish implications, the breakout has been down south following the collective crash. The bearish pressure put on the price from the Exponential 50-Moving Average was towering and within a 12-hour window, the asset dropped from $375 to below $345.
The selling pressure taking over was also identified on the Relative Strength Index chart, where the token dropped down to an extreme oversold position before attaining recovery. With the market was indicating choppy movements over the past 24-hours, a jump above $350 seems unlikely, while further depreciation cannot be taken out of the picture.
Bitcoin 5-hour chart
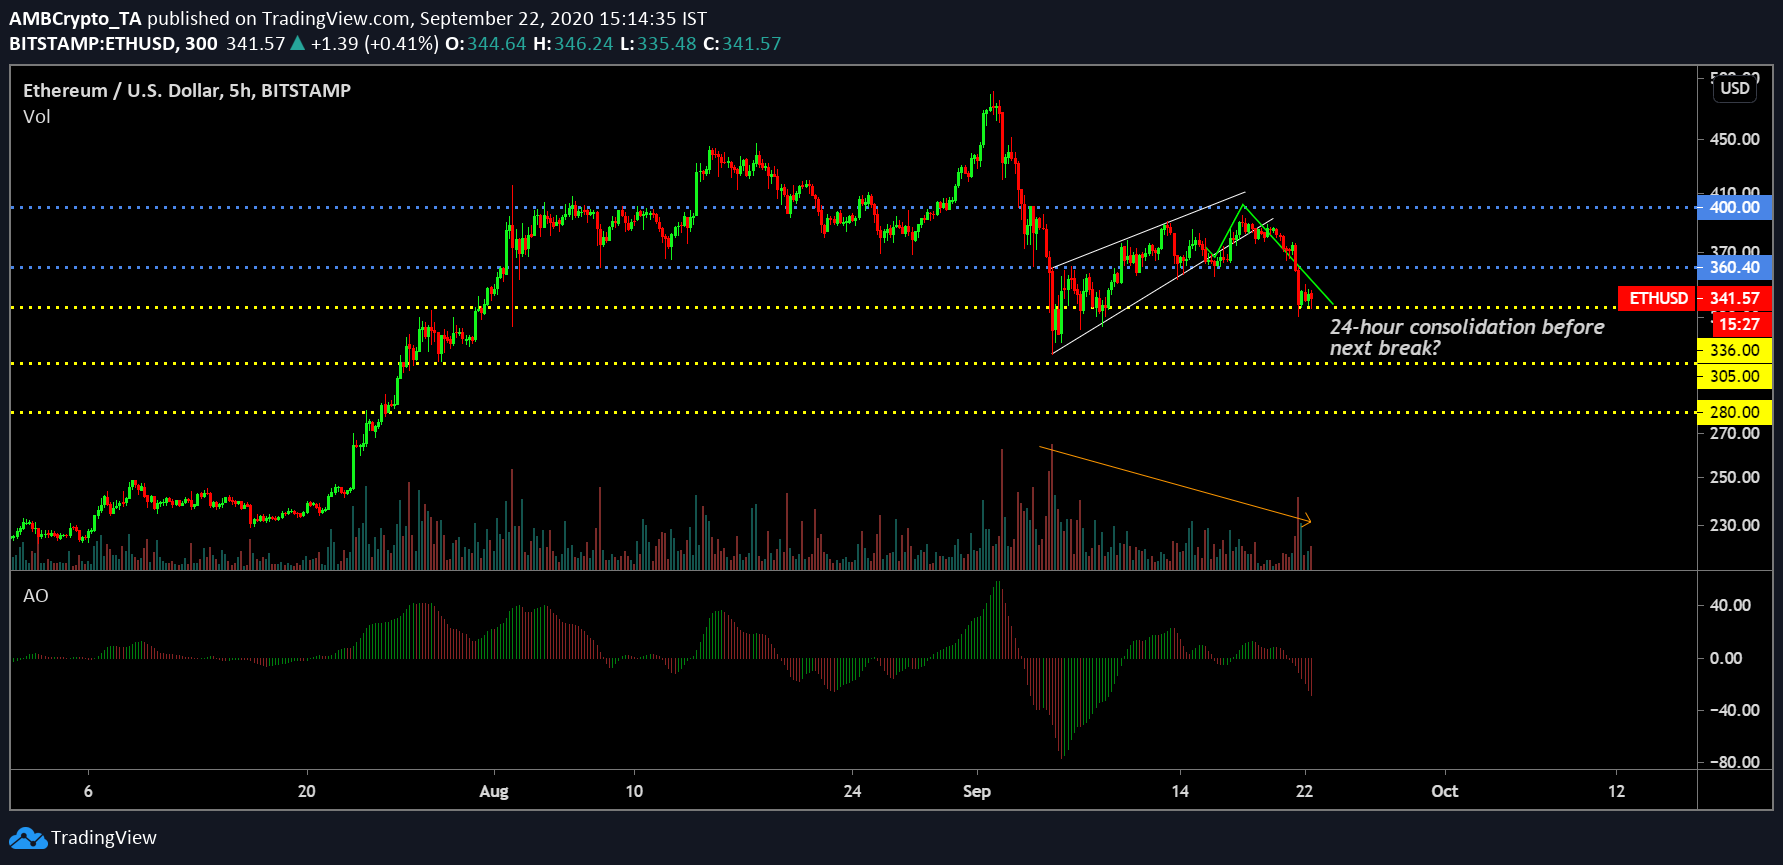
Source: ETH/USD on Trading View
Interestingly the 5-hour chart of Ethereum suggested that Ether is possibly at a make or break range at the moment. As observed, the price has followed the bearish breakout from the rising wedge like clockwork and it is currently right above the long-term support at $336. This leads up to two possibilities at the moment. Considering Ethereum hasn’t traded much in the current price point, a move upwards or downwards is likely to take place within the next 24-48 hours.
Awesome Oscillator is suggestive that the bearish pressure is only beginning to increase in the trend and it might carry the price all the way down to $305. On the other hand, the price can jump right up from $336 and attain a position close to $360. The next 24-hour will be critical but the trend is heavily inclined towards another drop.